Plant Phenology Team–Part 2
Home › Forums › APPLES Teacher Forum › Plant Phenology Team–Part 2
- This topic has 0 replies, 1 voice, and was last updated 8 years, 1 month ago by
 Kristin Joivell.
-
AuthorPosts
-
May 29, 2017 at 8:03 pm #577Kristin JoivellParticipant
It certainly took longer than I thought to be able to begin the work in the raised garden beds! I thought my students would be outside planting seedlings in March or April, but I didn’t realize how late it is necessary to wait so that the plants won’t be killed from the cold at night. The danger of frost from unusually cold weather in early spring kept the actual work outside from beginning until early April. But once it began, it was a frenzied wave of activity! I got the OTC plot and the fenced plot in the raised garden bed ready and set up for use at the beginning of April.
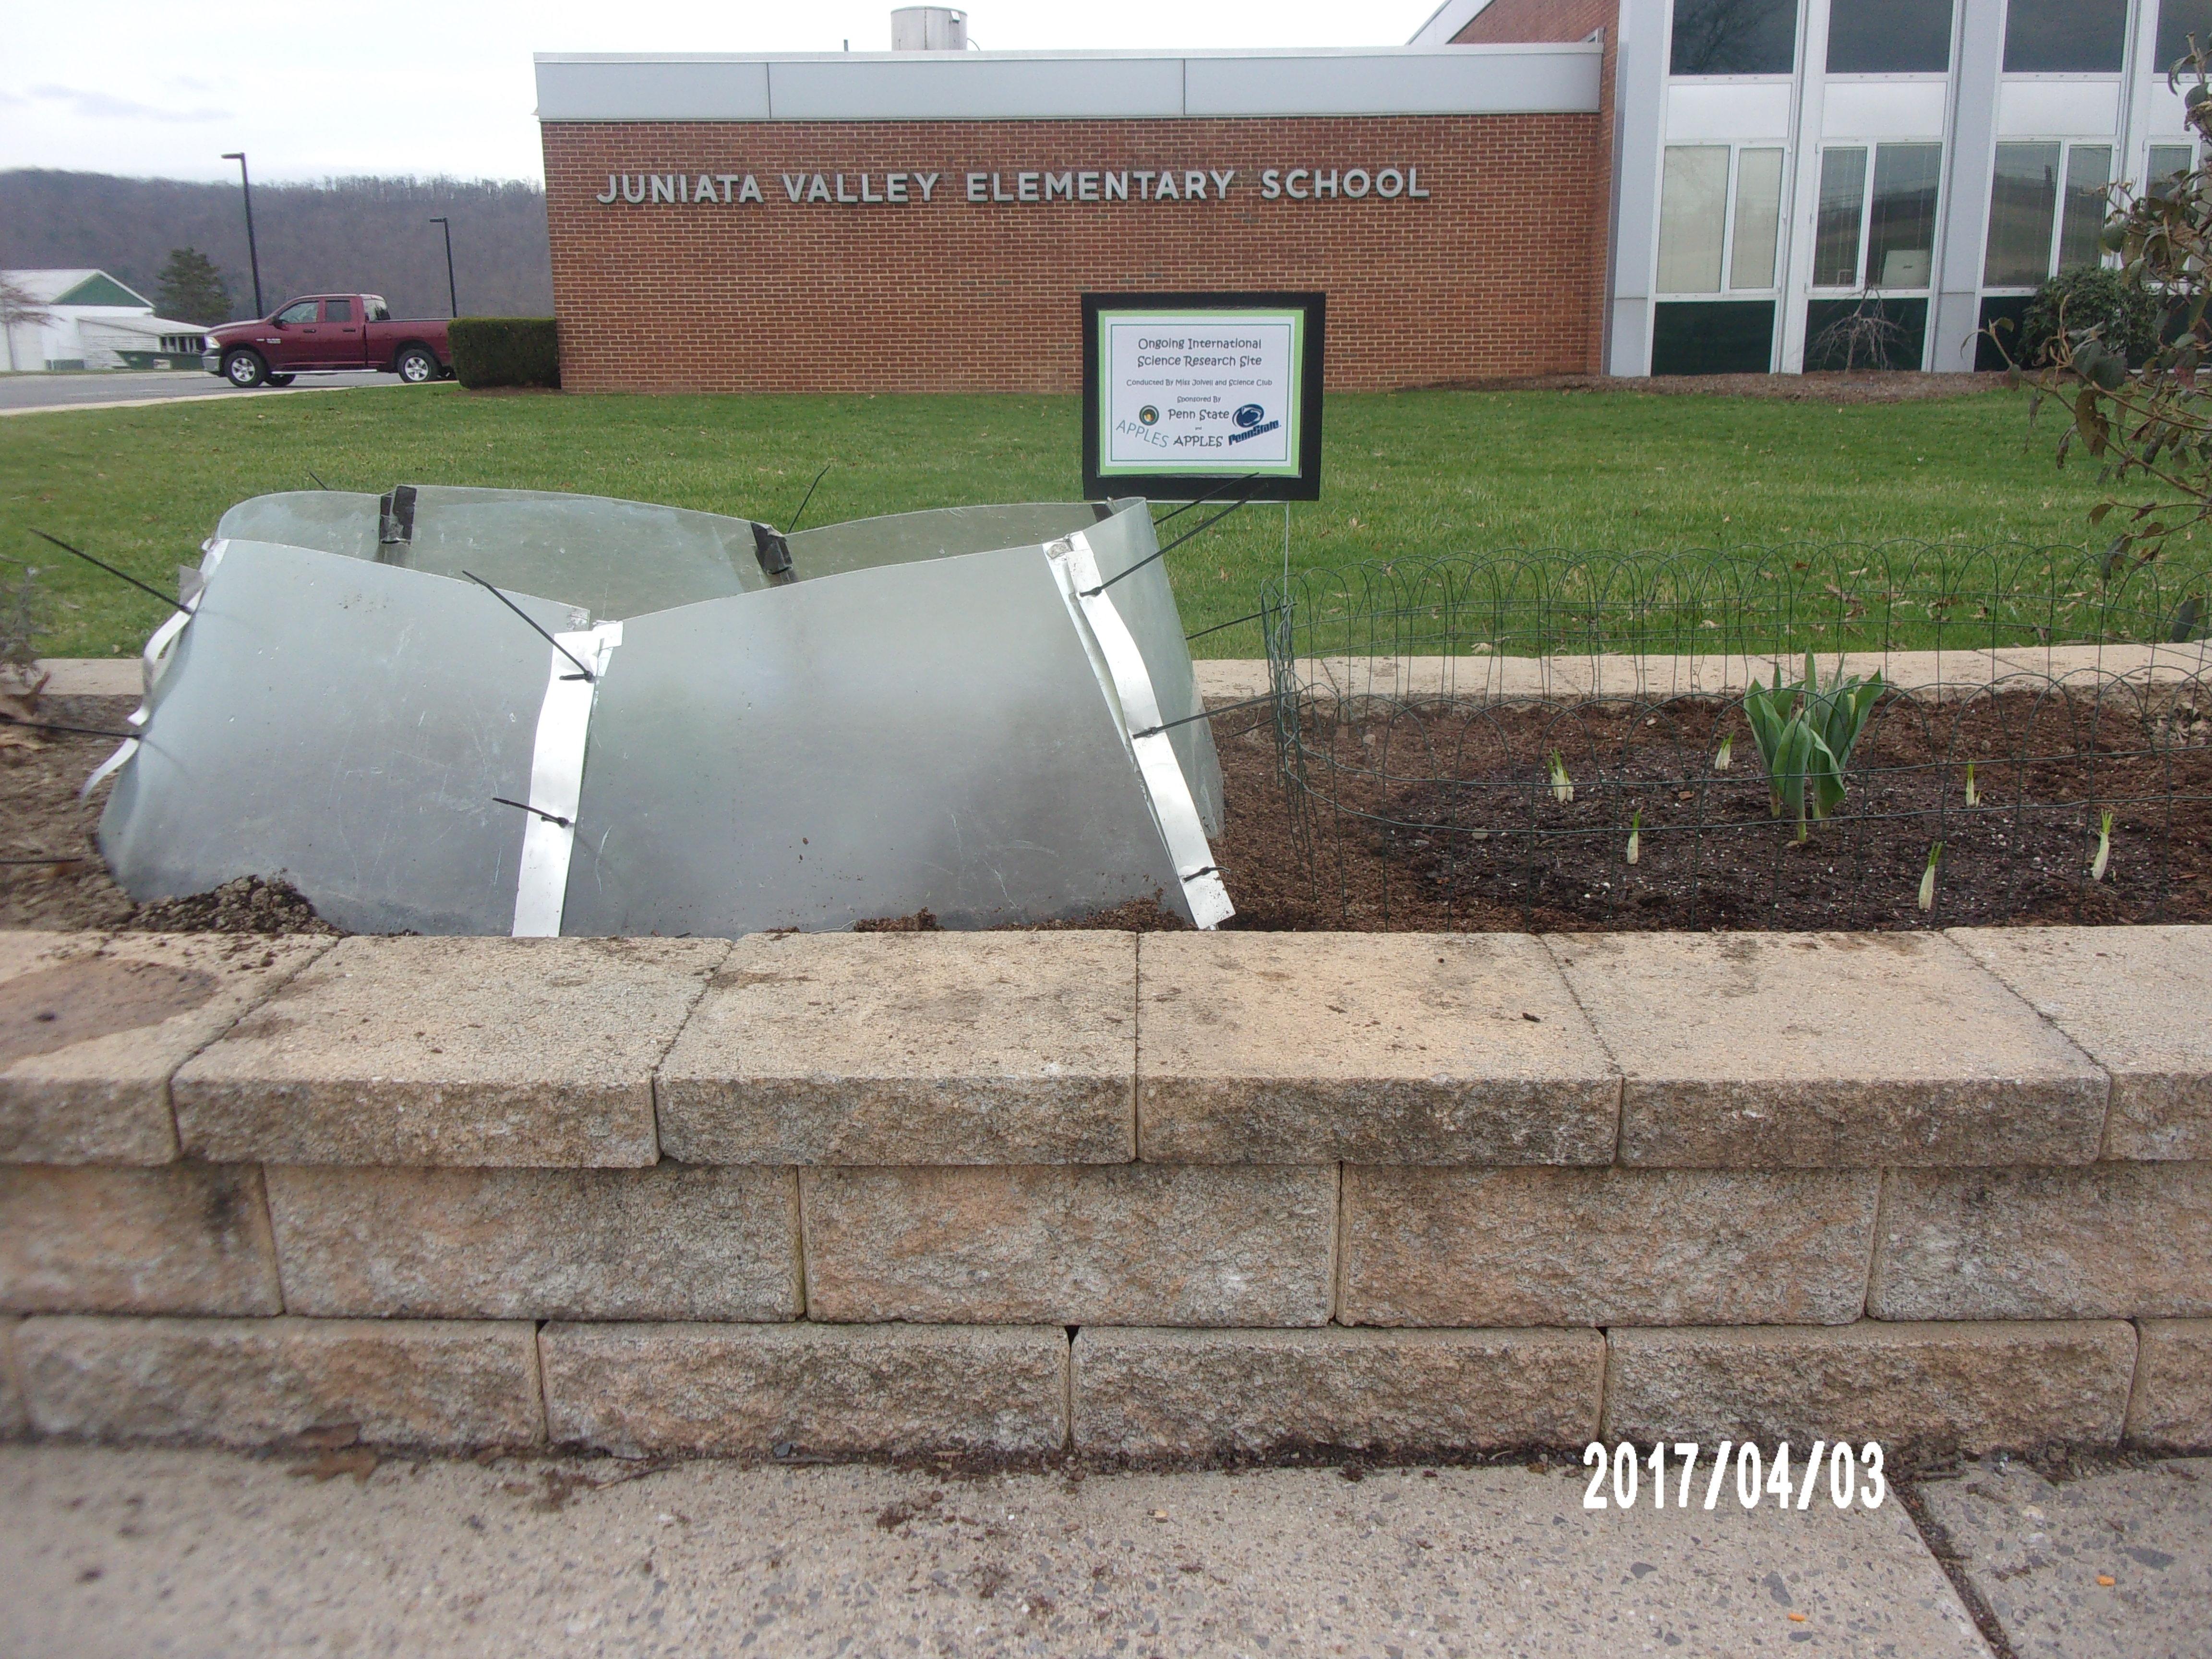
First of all, I decided to plant crocus and tulip bulbs from a local garden center at the beginning of April due to the risk of frost killing the plants that I originally planned on. I was going to plant basil in the raised garden beds, but learned that it’s not advisable to begin outdoor plantings until mid or late May! So I started the basil seeds in my classroom’s indoor garden so that these plants are ready for transplanting outdoors at the end of the school year at the beginning of June. That way, they have all summer to grow in the outdoor raised garden beds and will be ready for phenology observations in late August for the beginning of next school year.
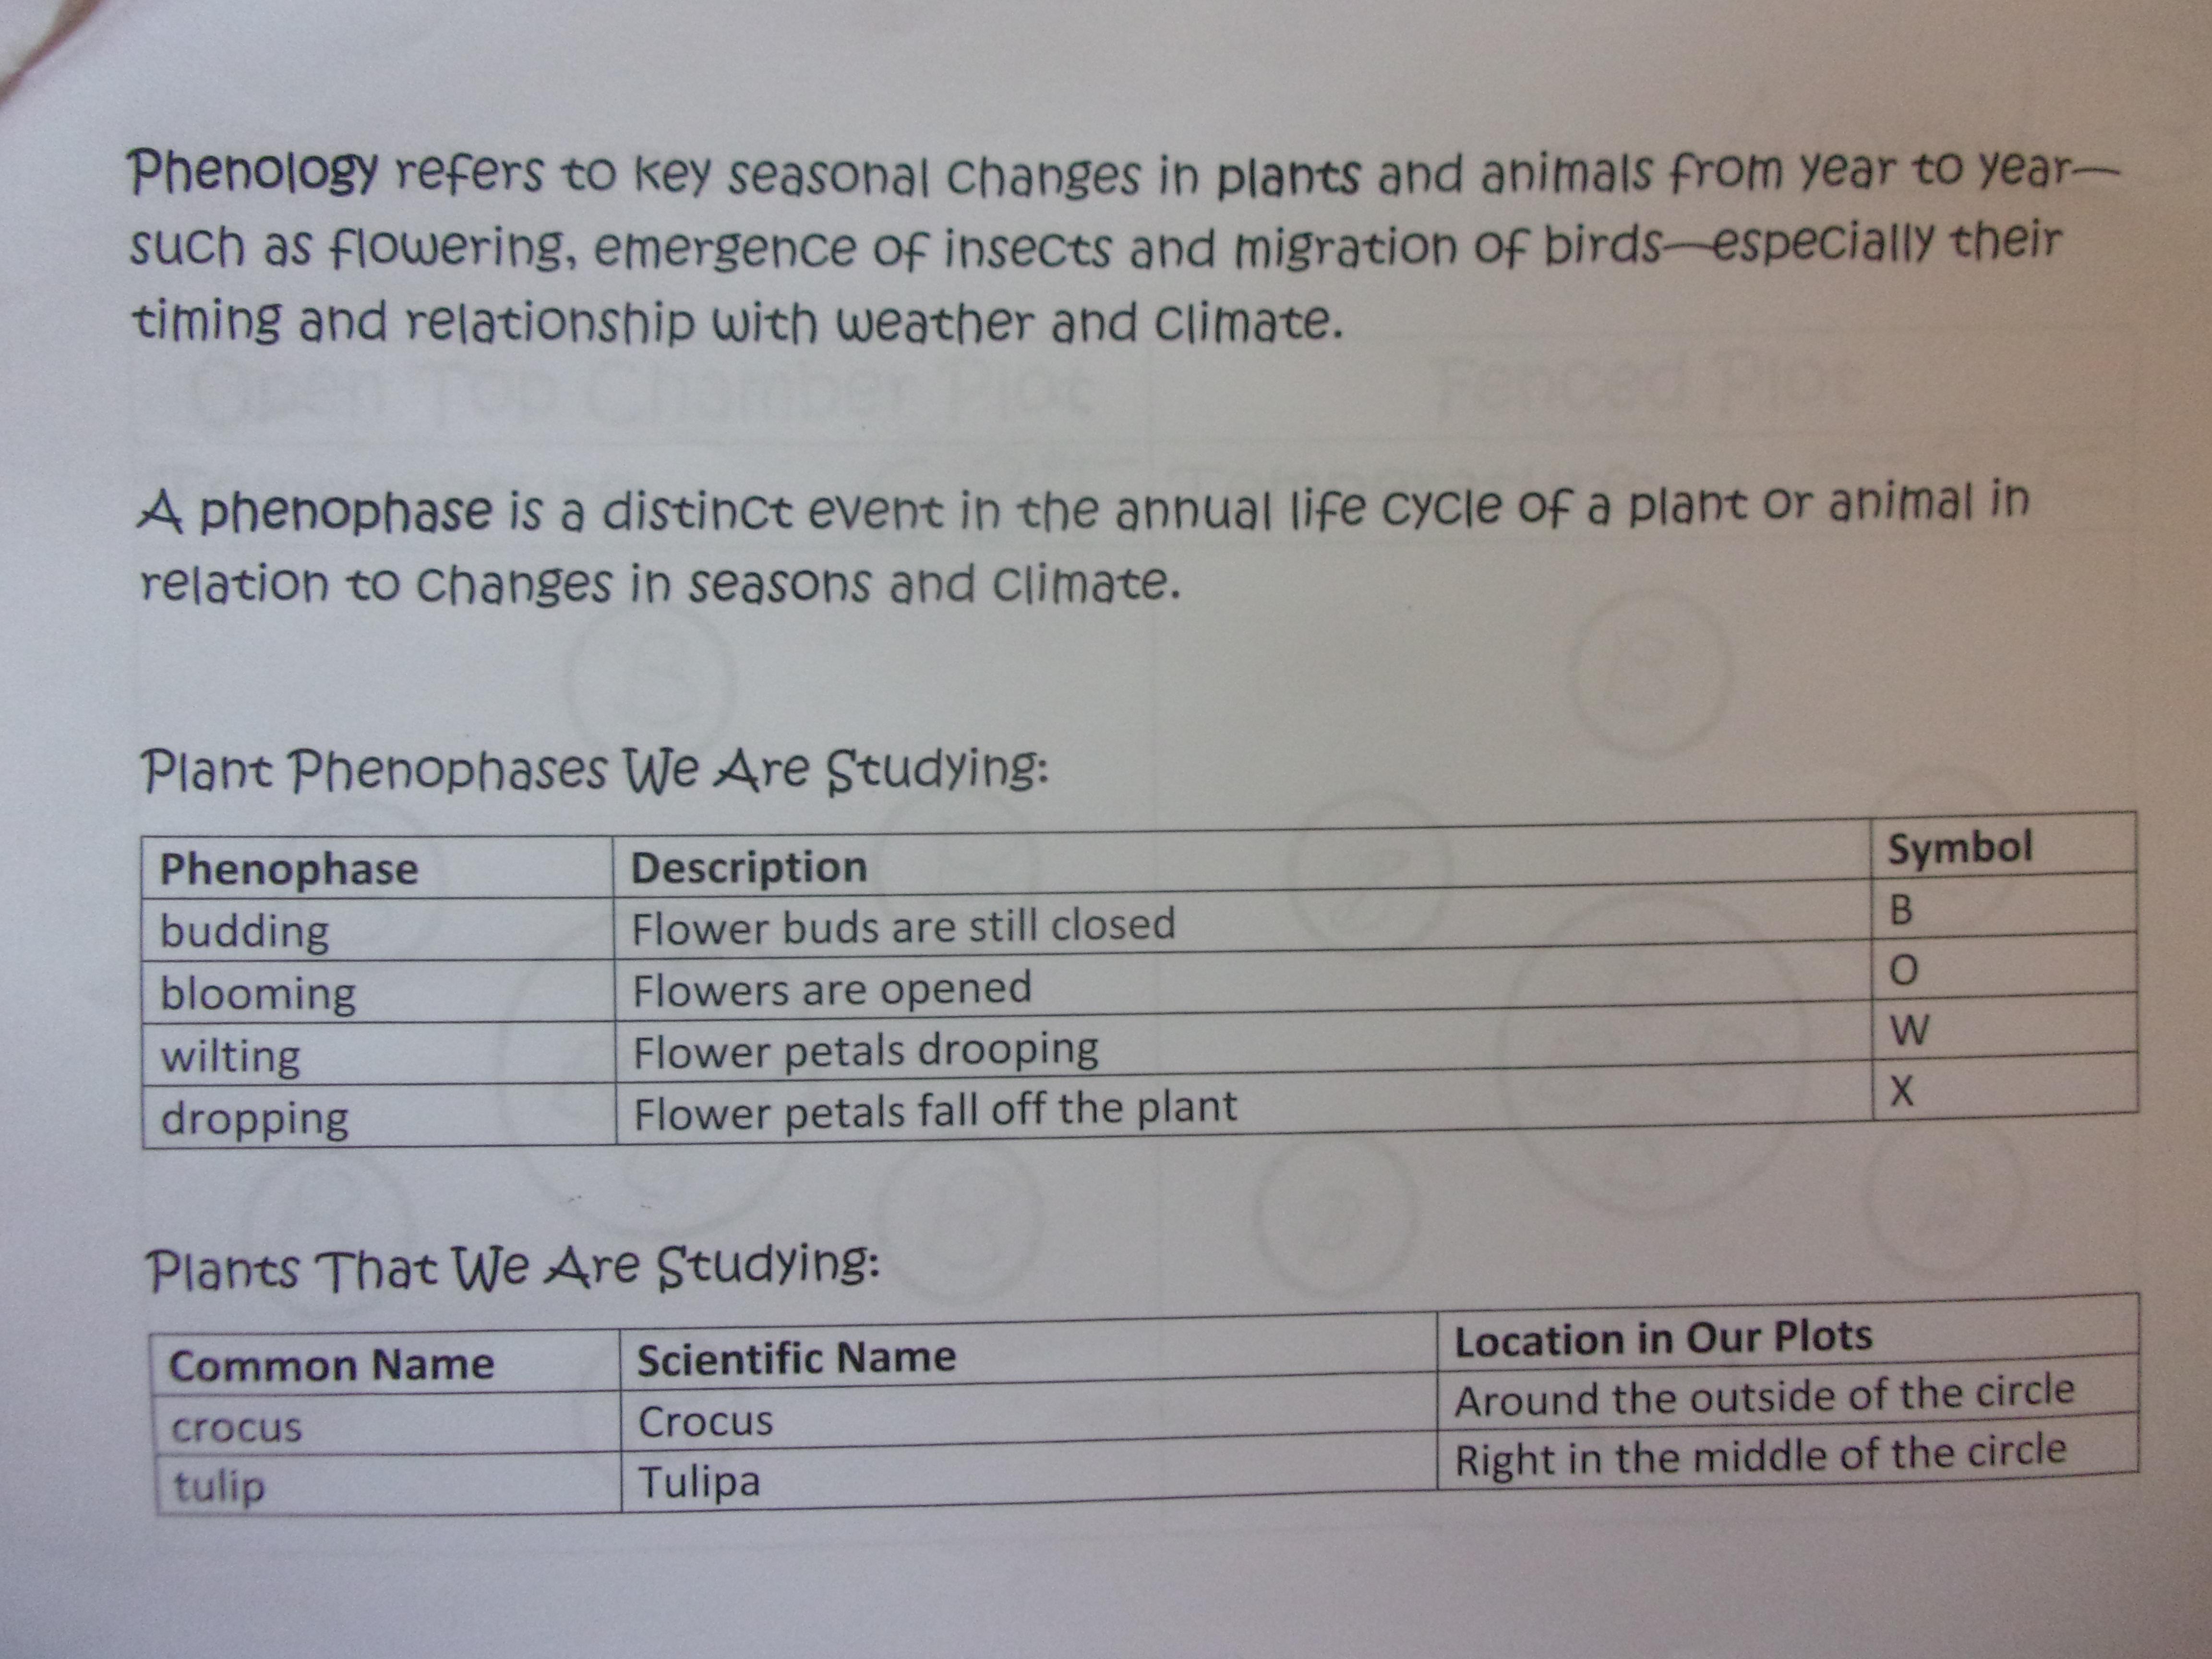
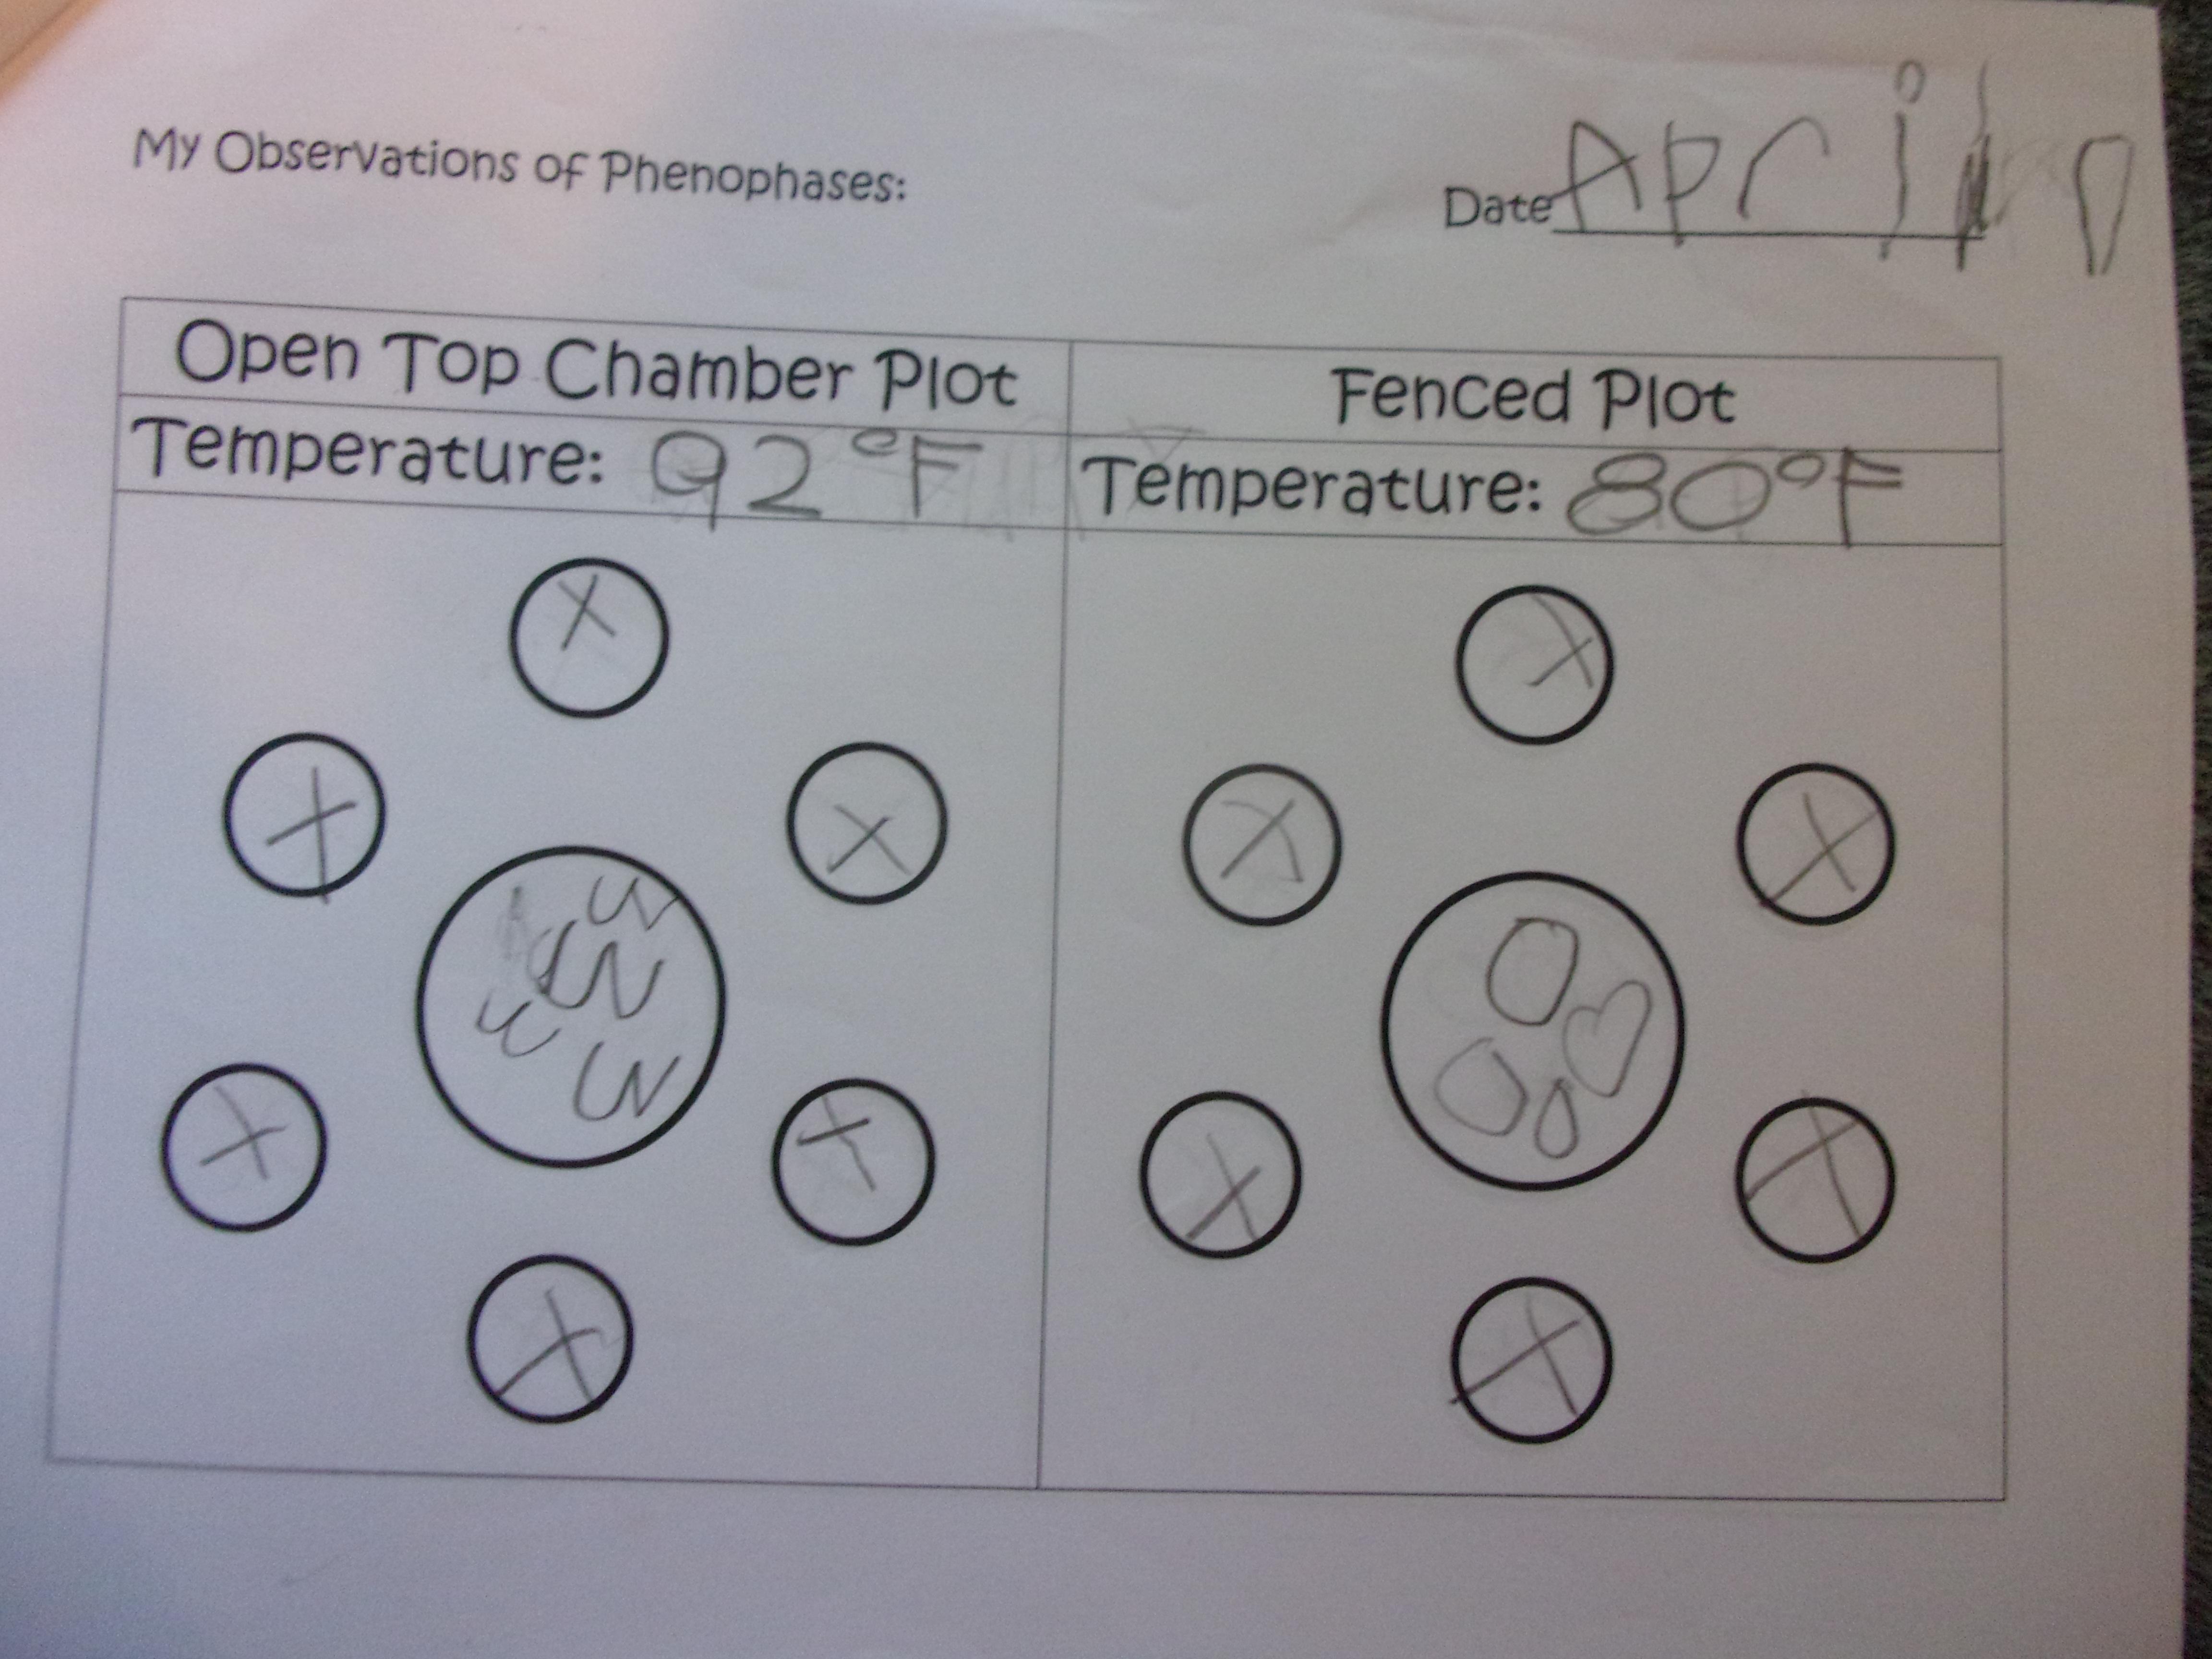
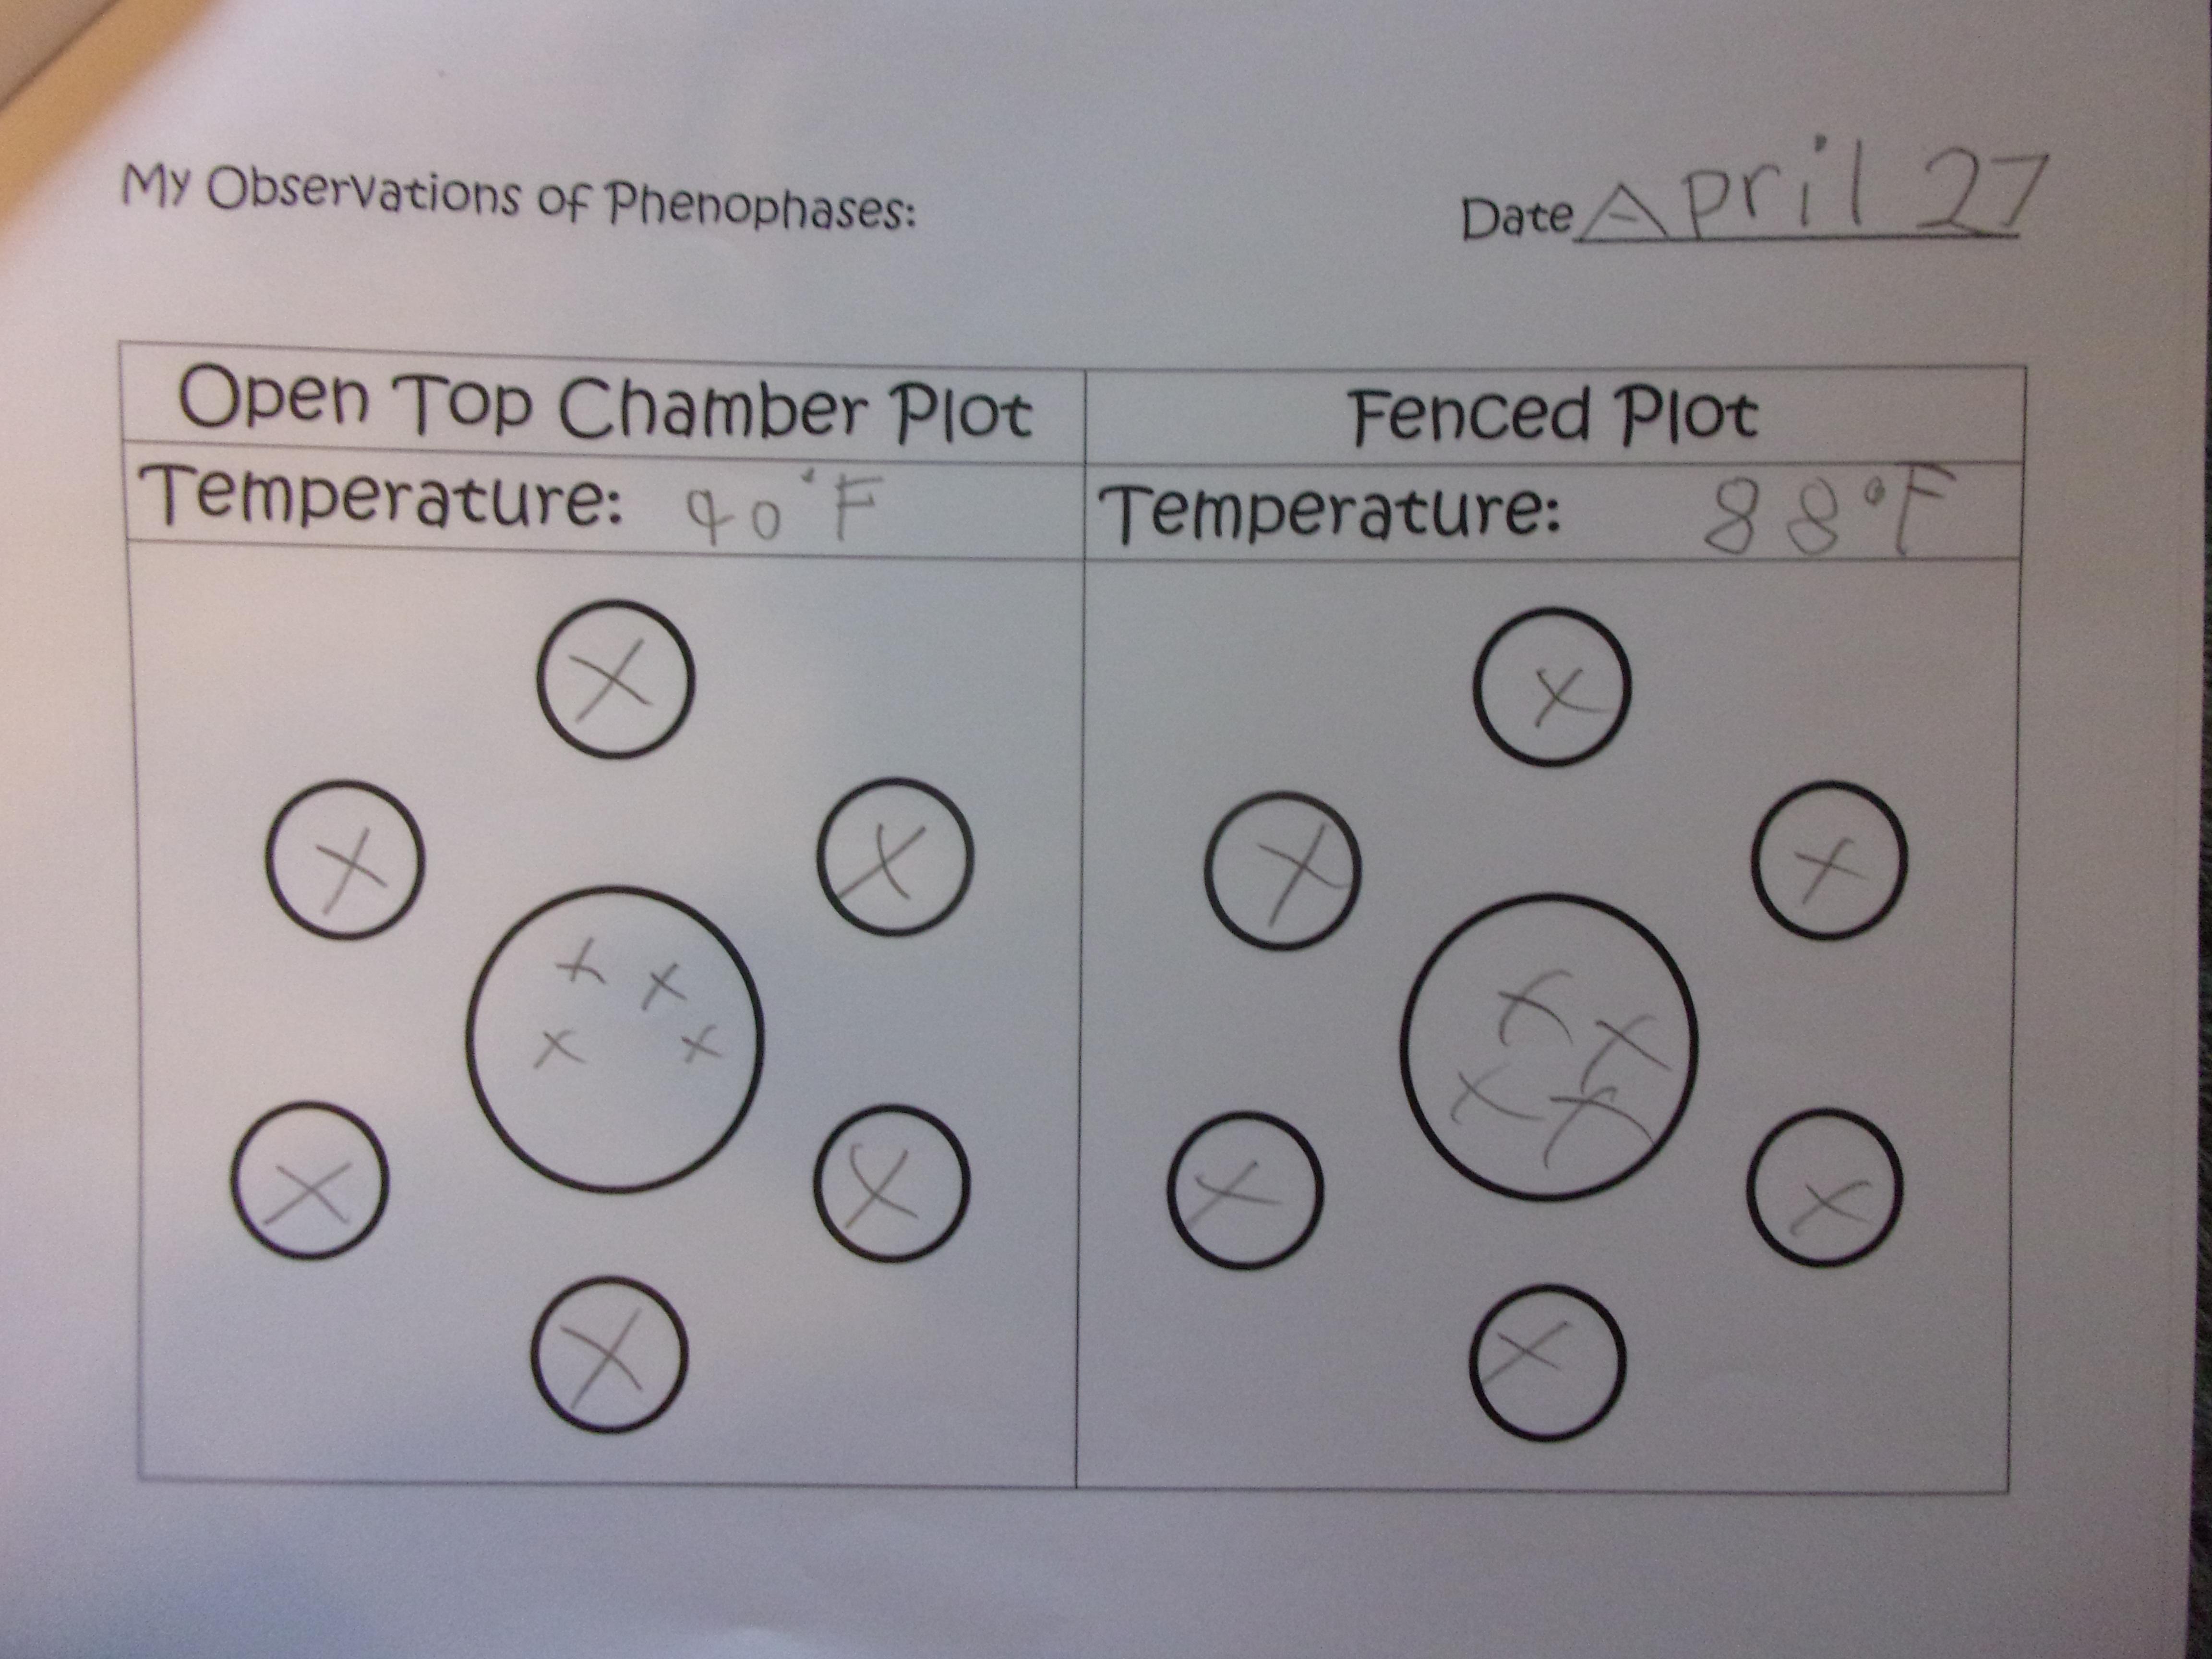
Before getting the actual observations started with the students, I conducted a phenophase training session with them to practice identifying phenophases–budding, blooming, wilting, and dropping–as described on the journal page below. As you can see, I decided to use a single letter to code each phenophase for each plant. This actually worked out great for this study of the simple crocus and tulip plants!
During the phenophase training session, I also shared Dasha Savage’s Ted ED Video “How Plants Tell Time” with the class to help them understand the concept better. https://www.youtube.com/watch?v=3jIW5wW2WC0
Making comparisons between the OTC and fenced plots was facilitated by the fact that I arranged the tulip bulbs in the center of a circle and the crocus bulbs on the outside of the circle, sort of like the face of a clock. When the students recorded their phenophase data in their plant phenology journals, it was simple for them to look at the center of the circle and then move around it one plant at a time to record the data.
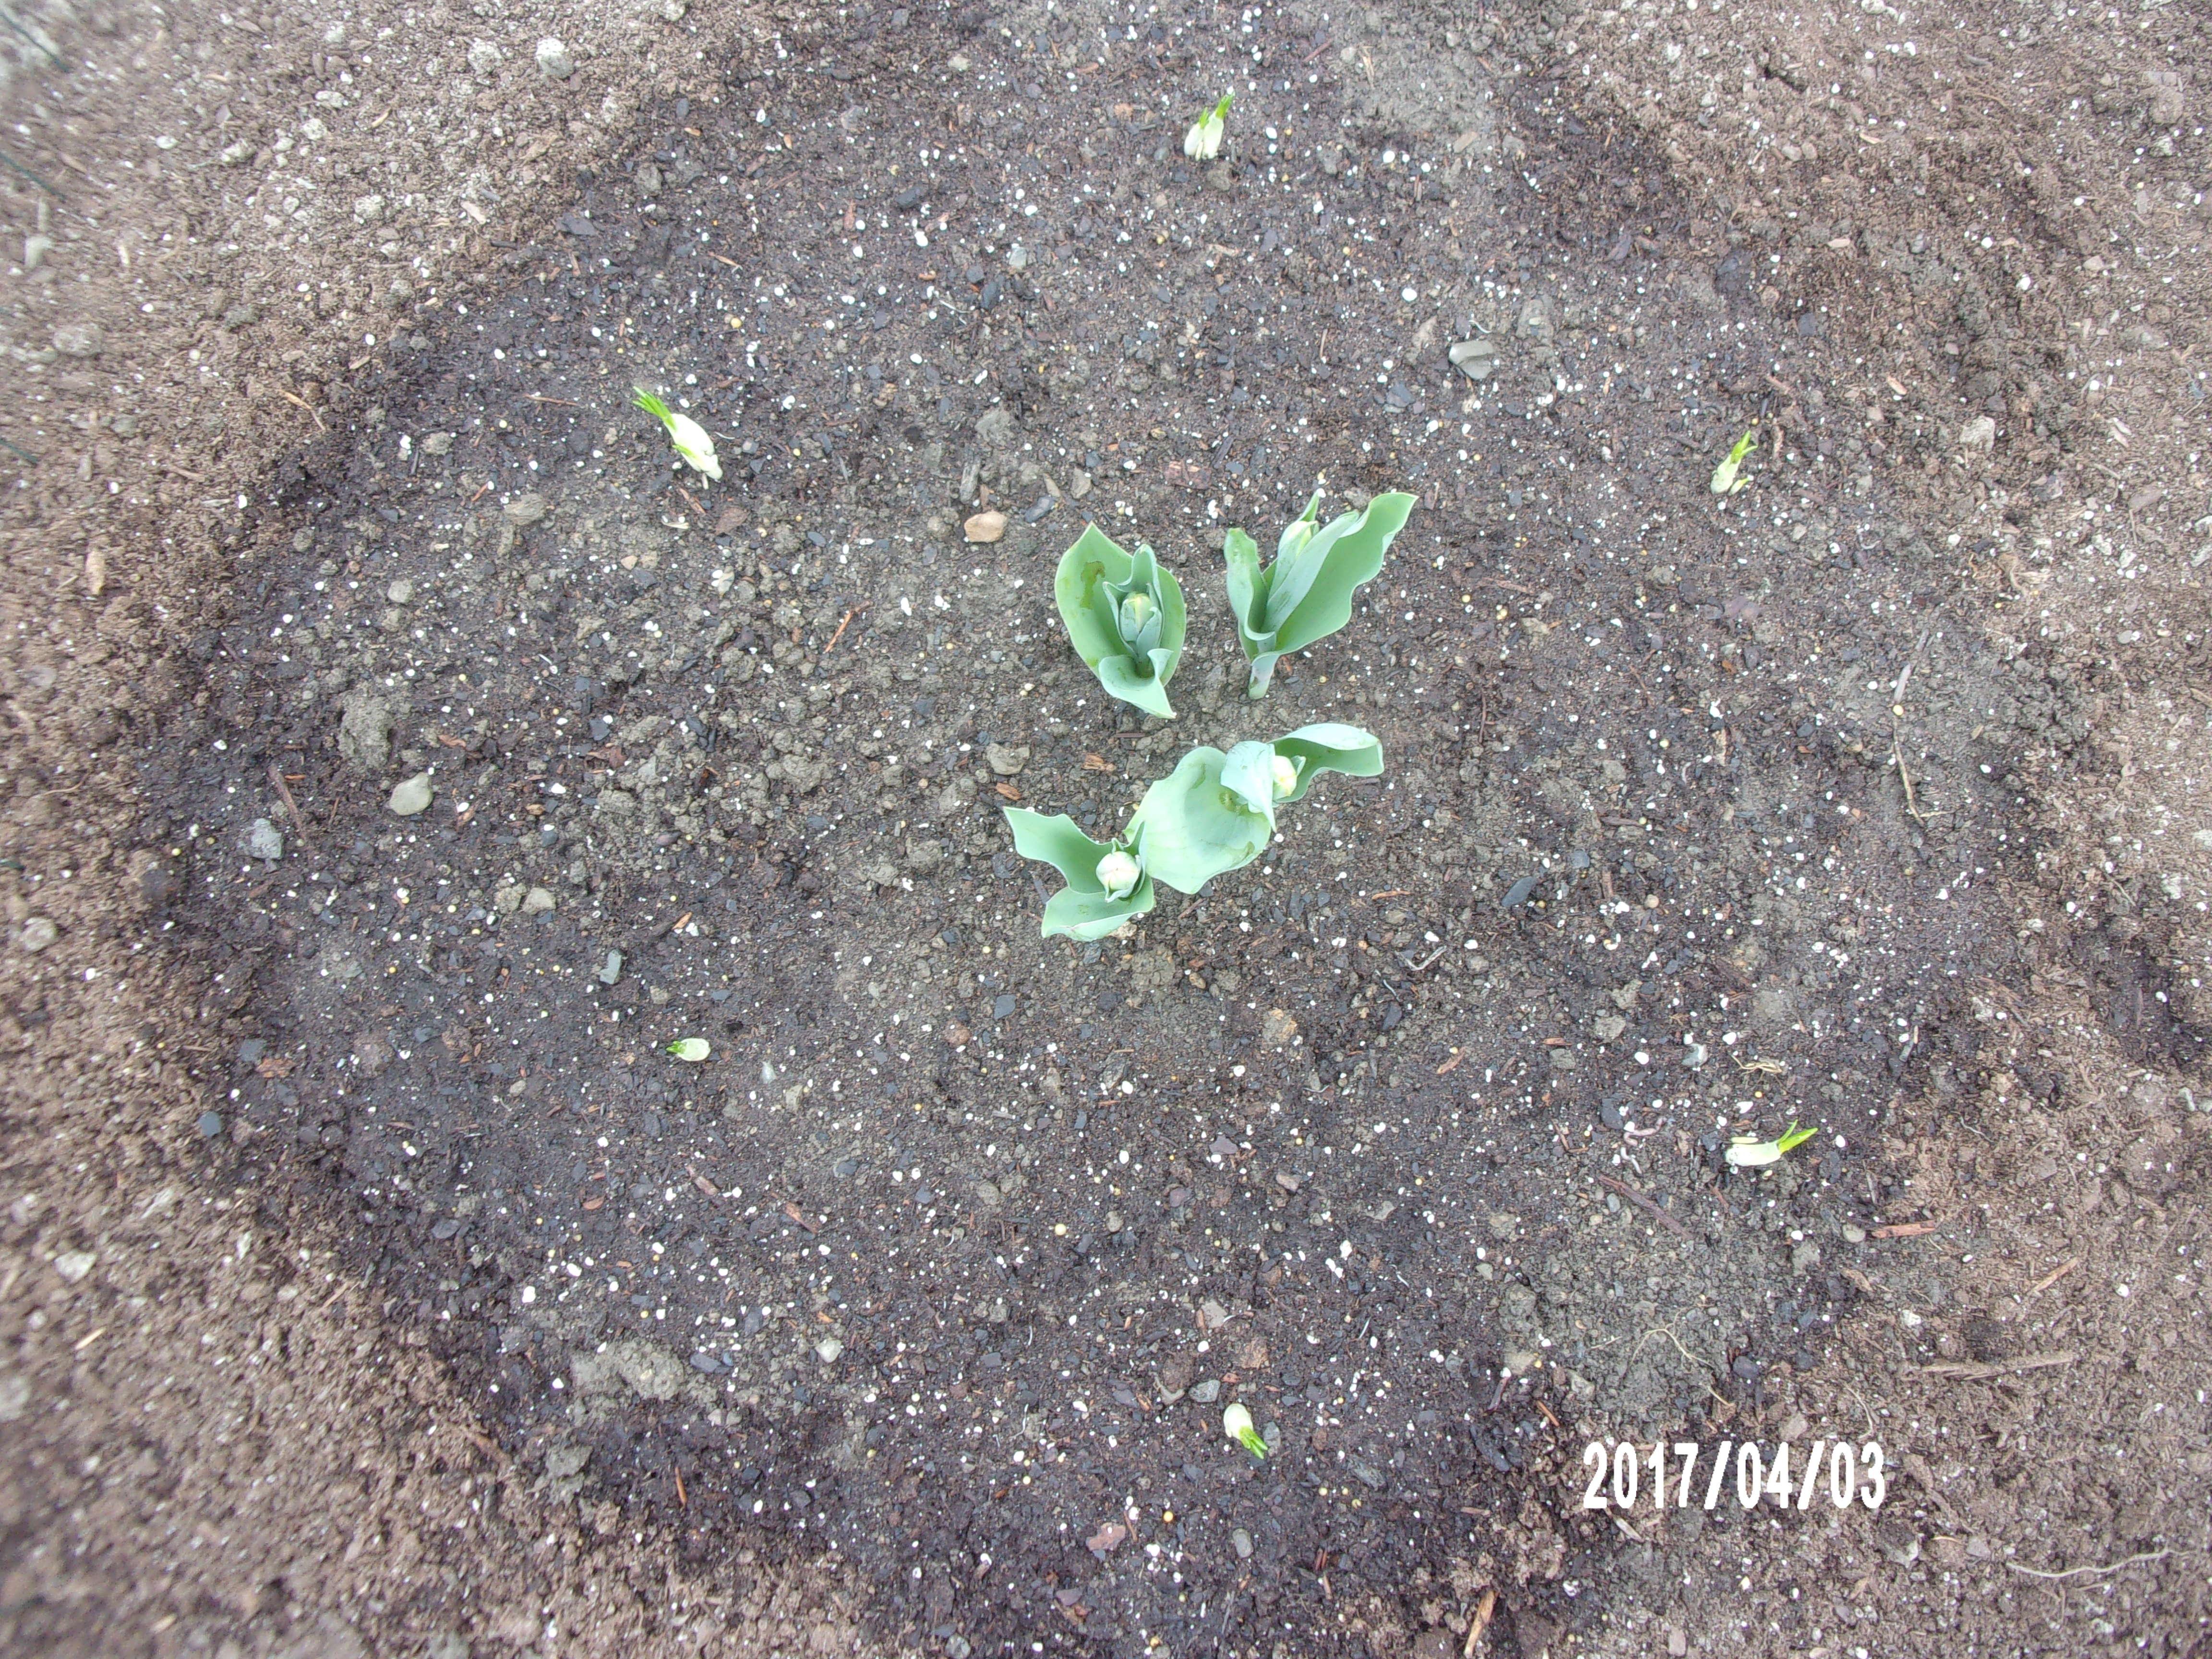
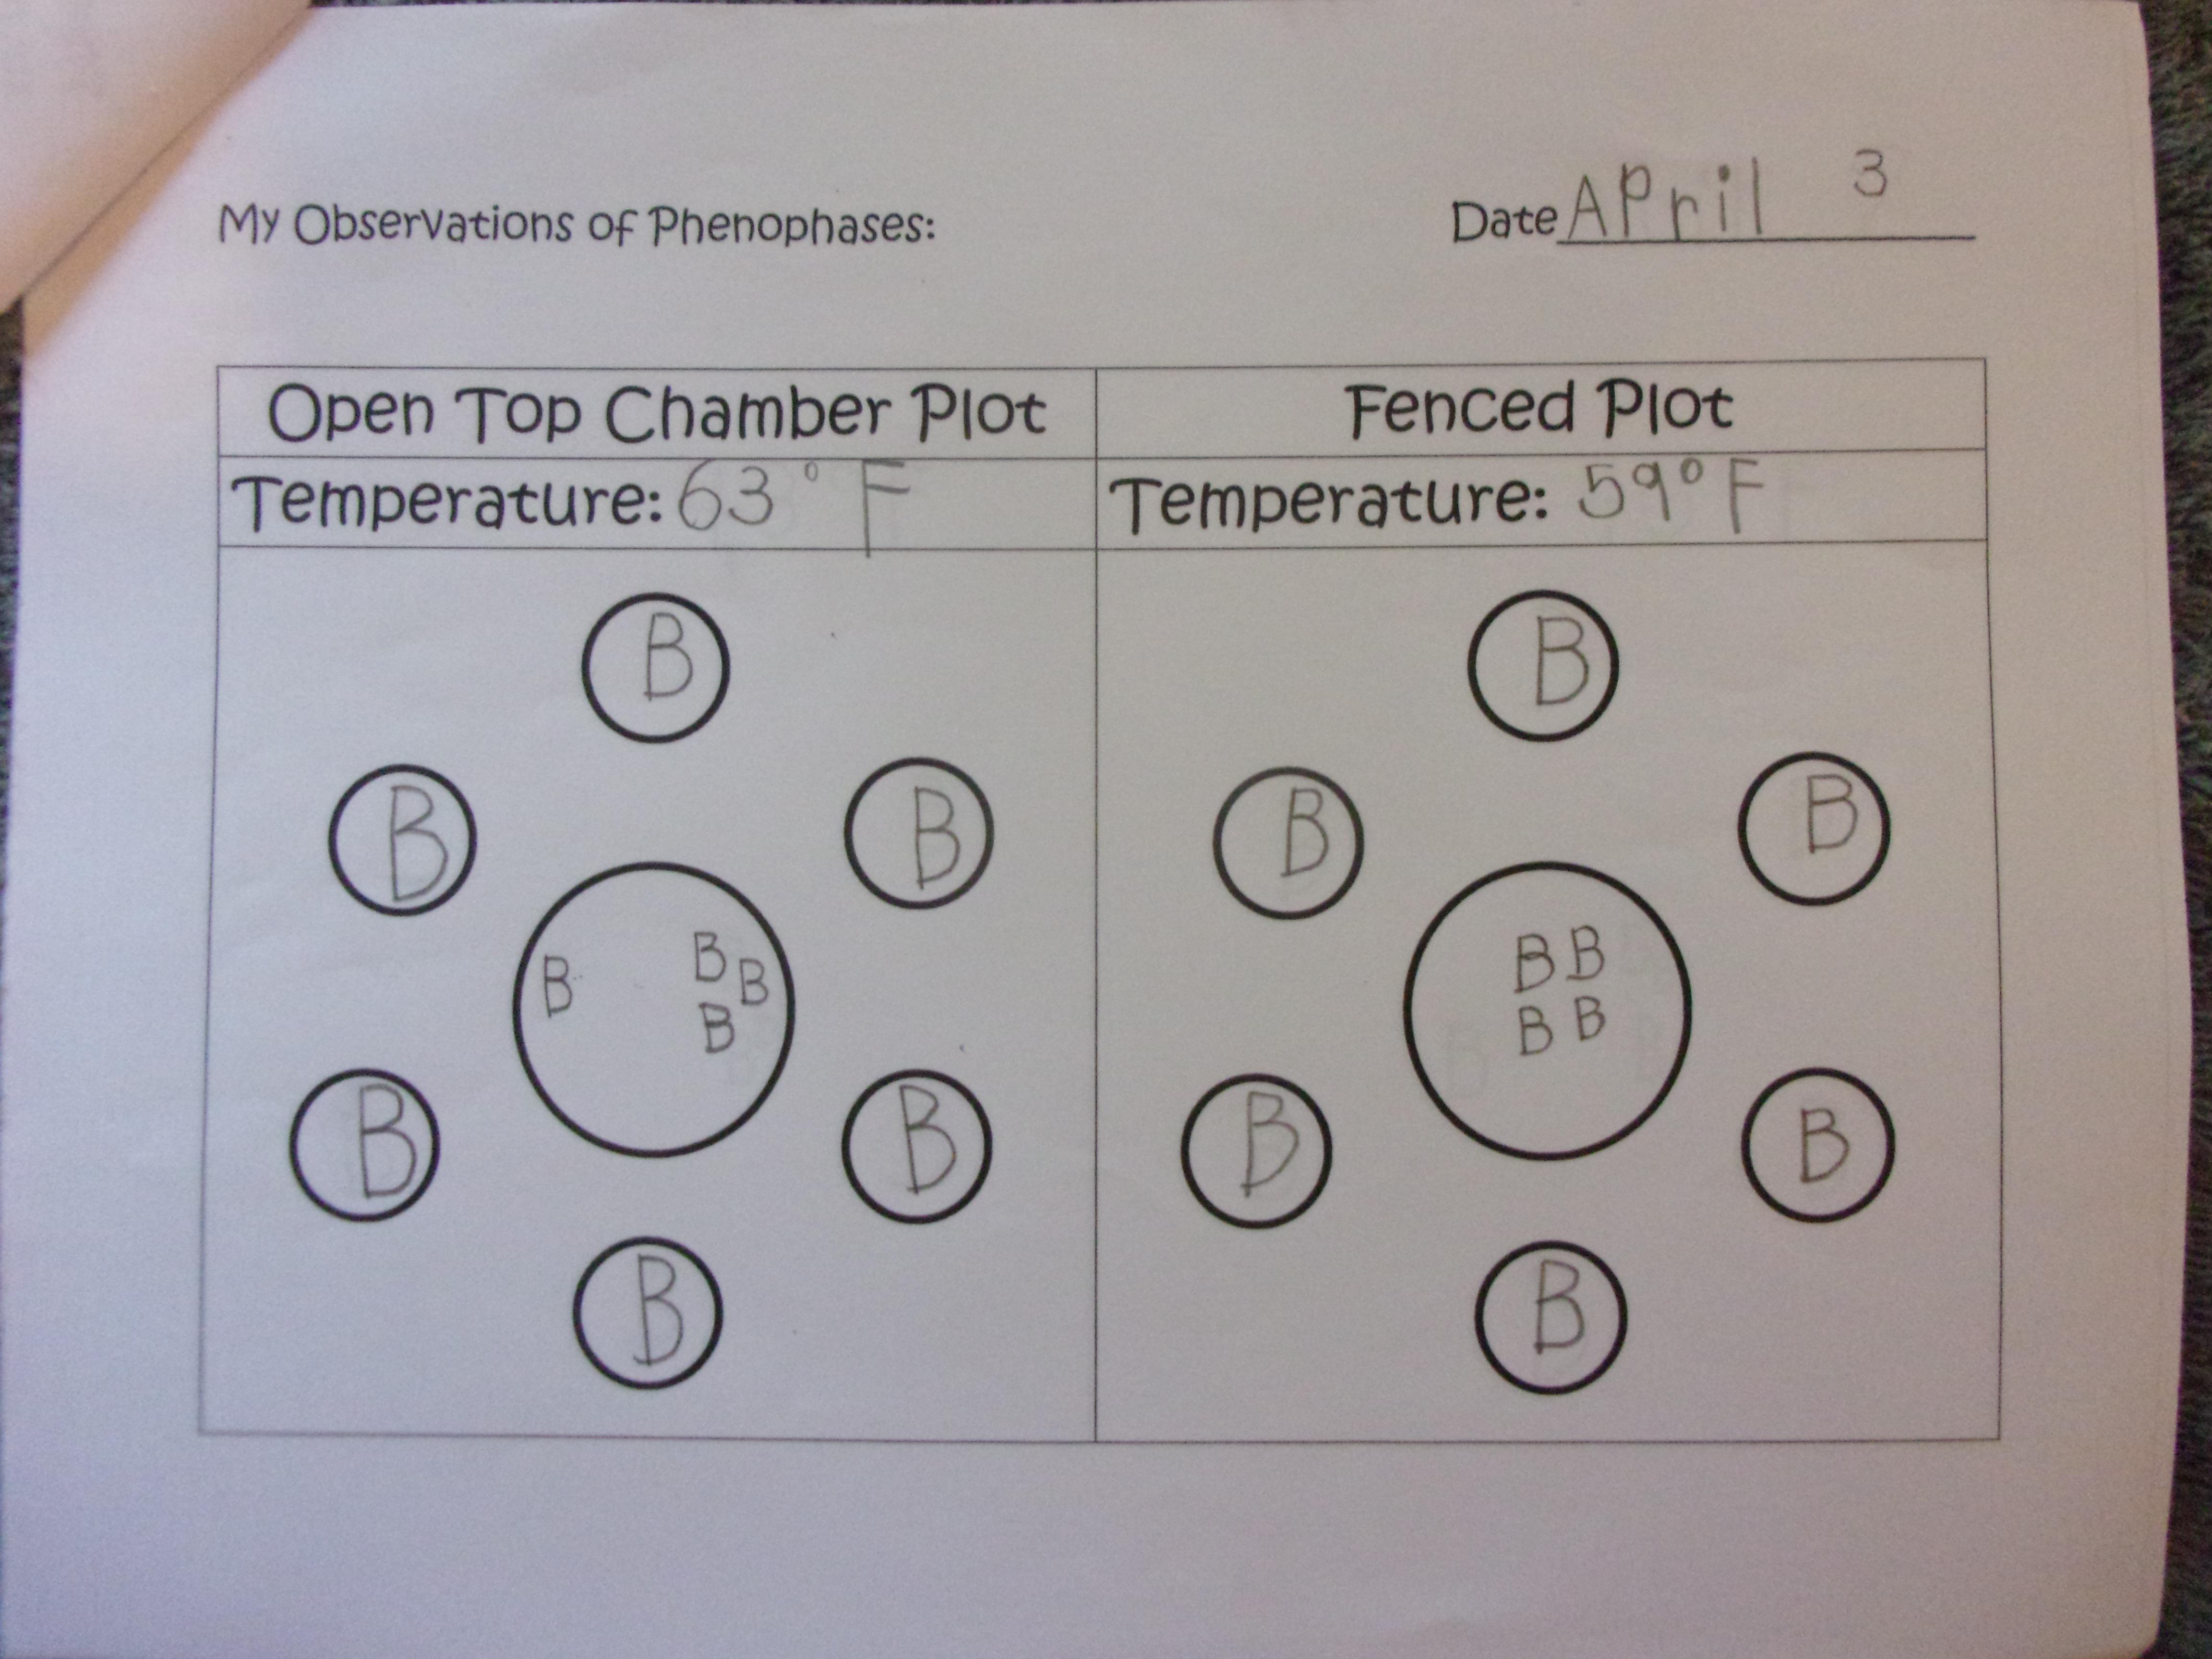
On April 3, you can see that both types of plants in both plots were still in the budding stage, although after just 2 days of growing the in the different plots was affecting the growth of the plants. The plants in the OTC plot pictured first are further along in the budding stage, getting closer to blooming than the plants in the fenced plot pictured second. At this point I was using the digital thermometer as my main source of data for temperature readings, but found that it was taking too long to get the reading. So I decided to still use the digital thermometer, but place an permanent thermometer in each plot for quicker and easier temperature readings.
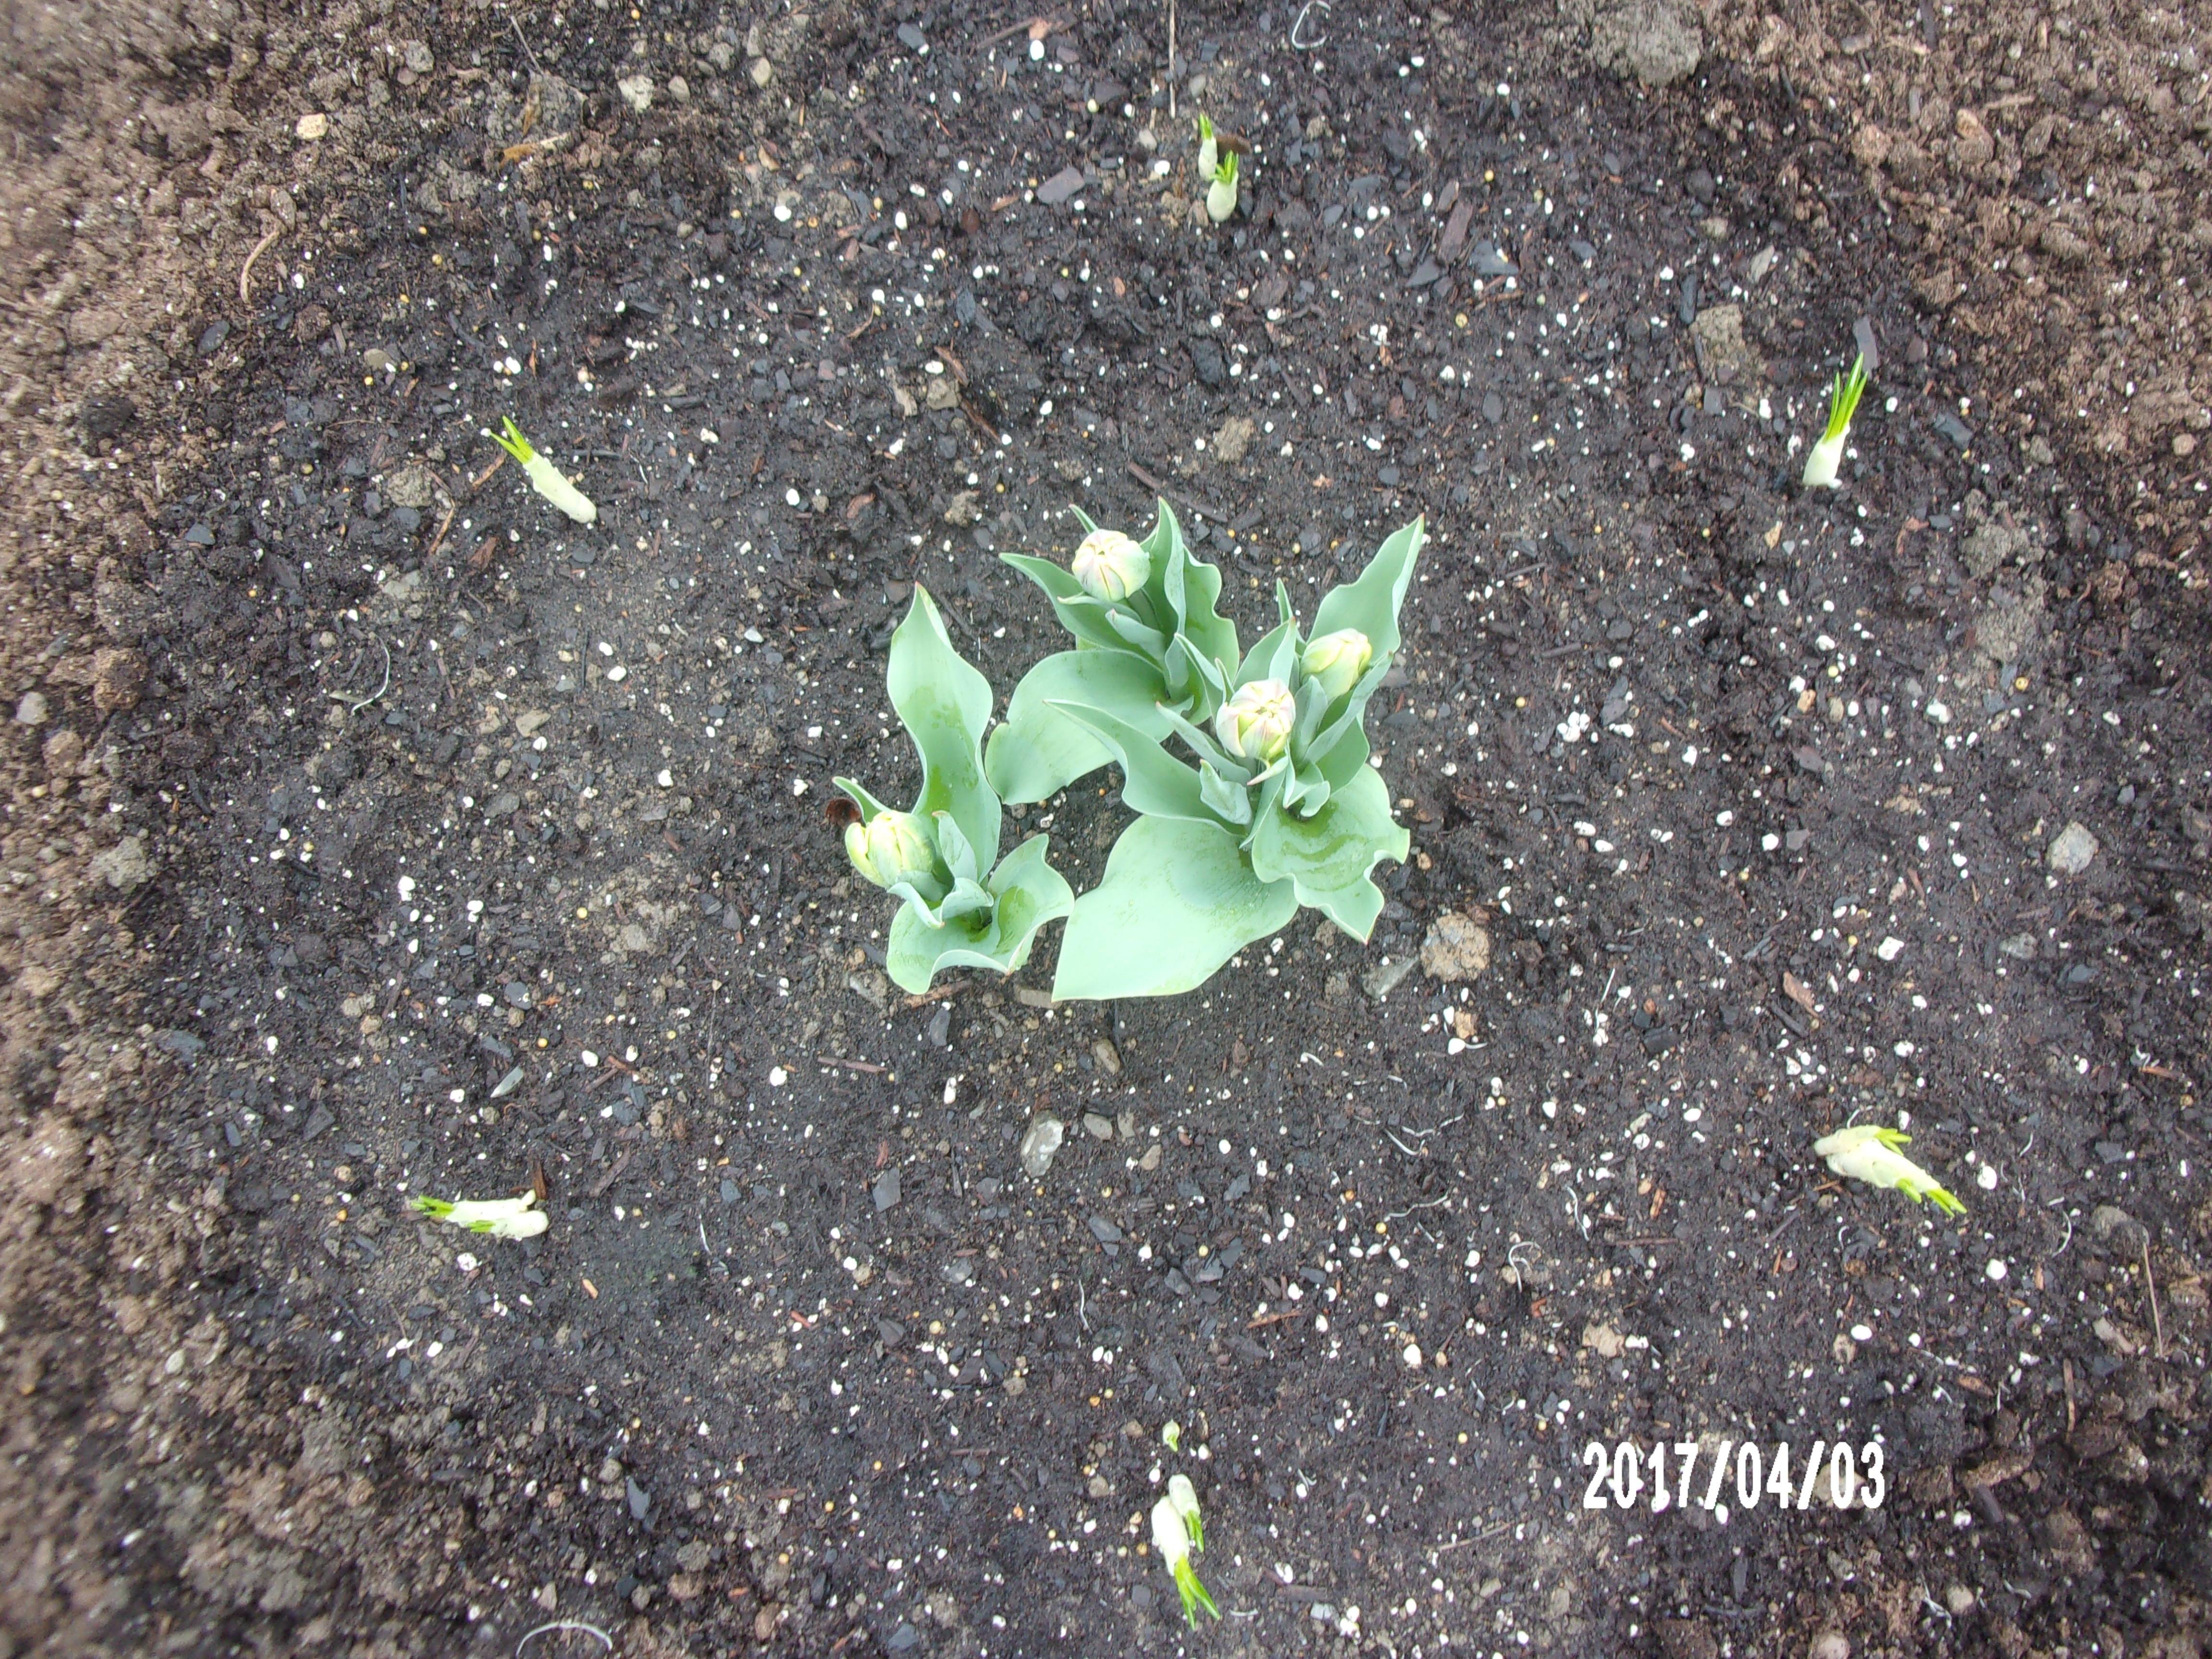
Student data for the two plots on April 3 was coded with a letter for each phenophase–B for budding, O for blooming, W for wilting, and X for dropping. As you can see the student journal entry uses the code for all plants in both plots as B–budding.
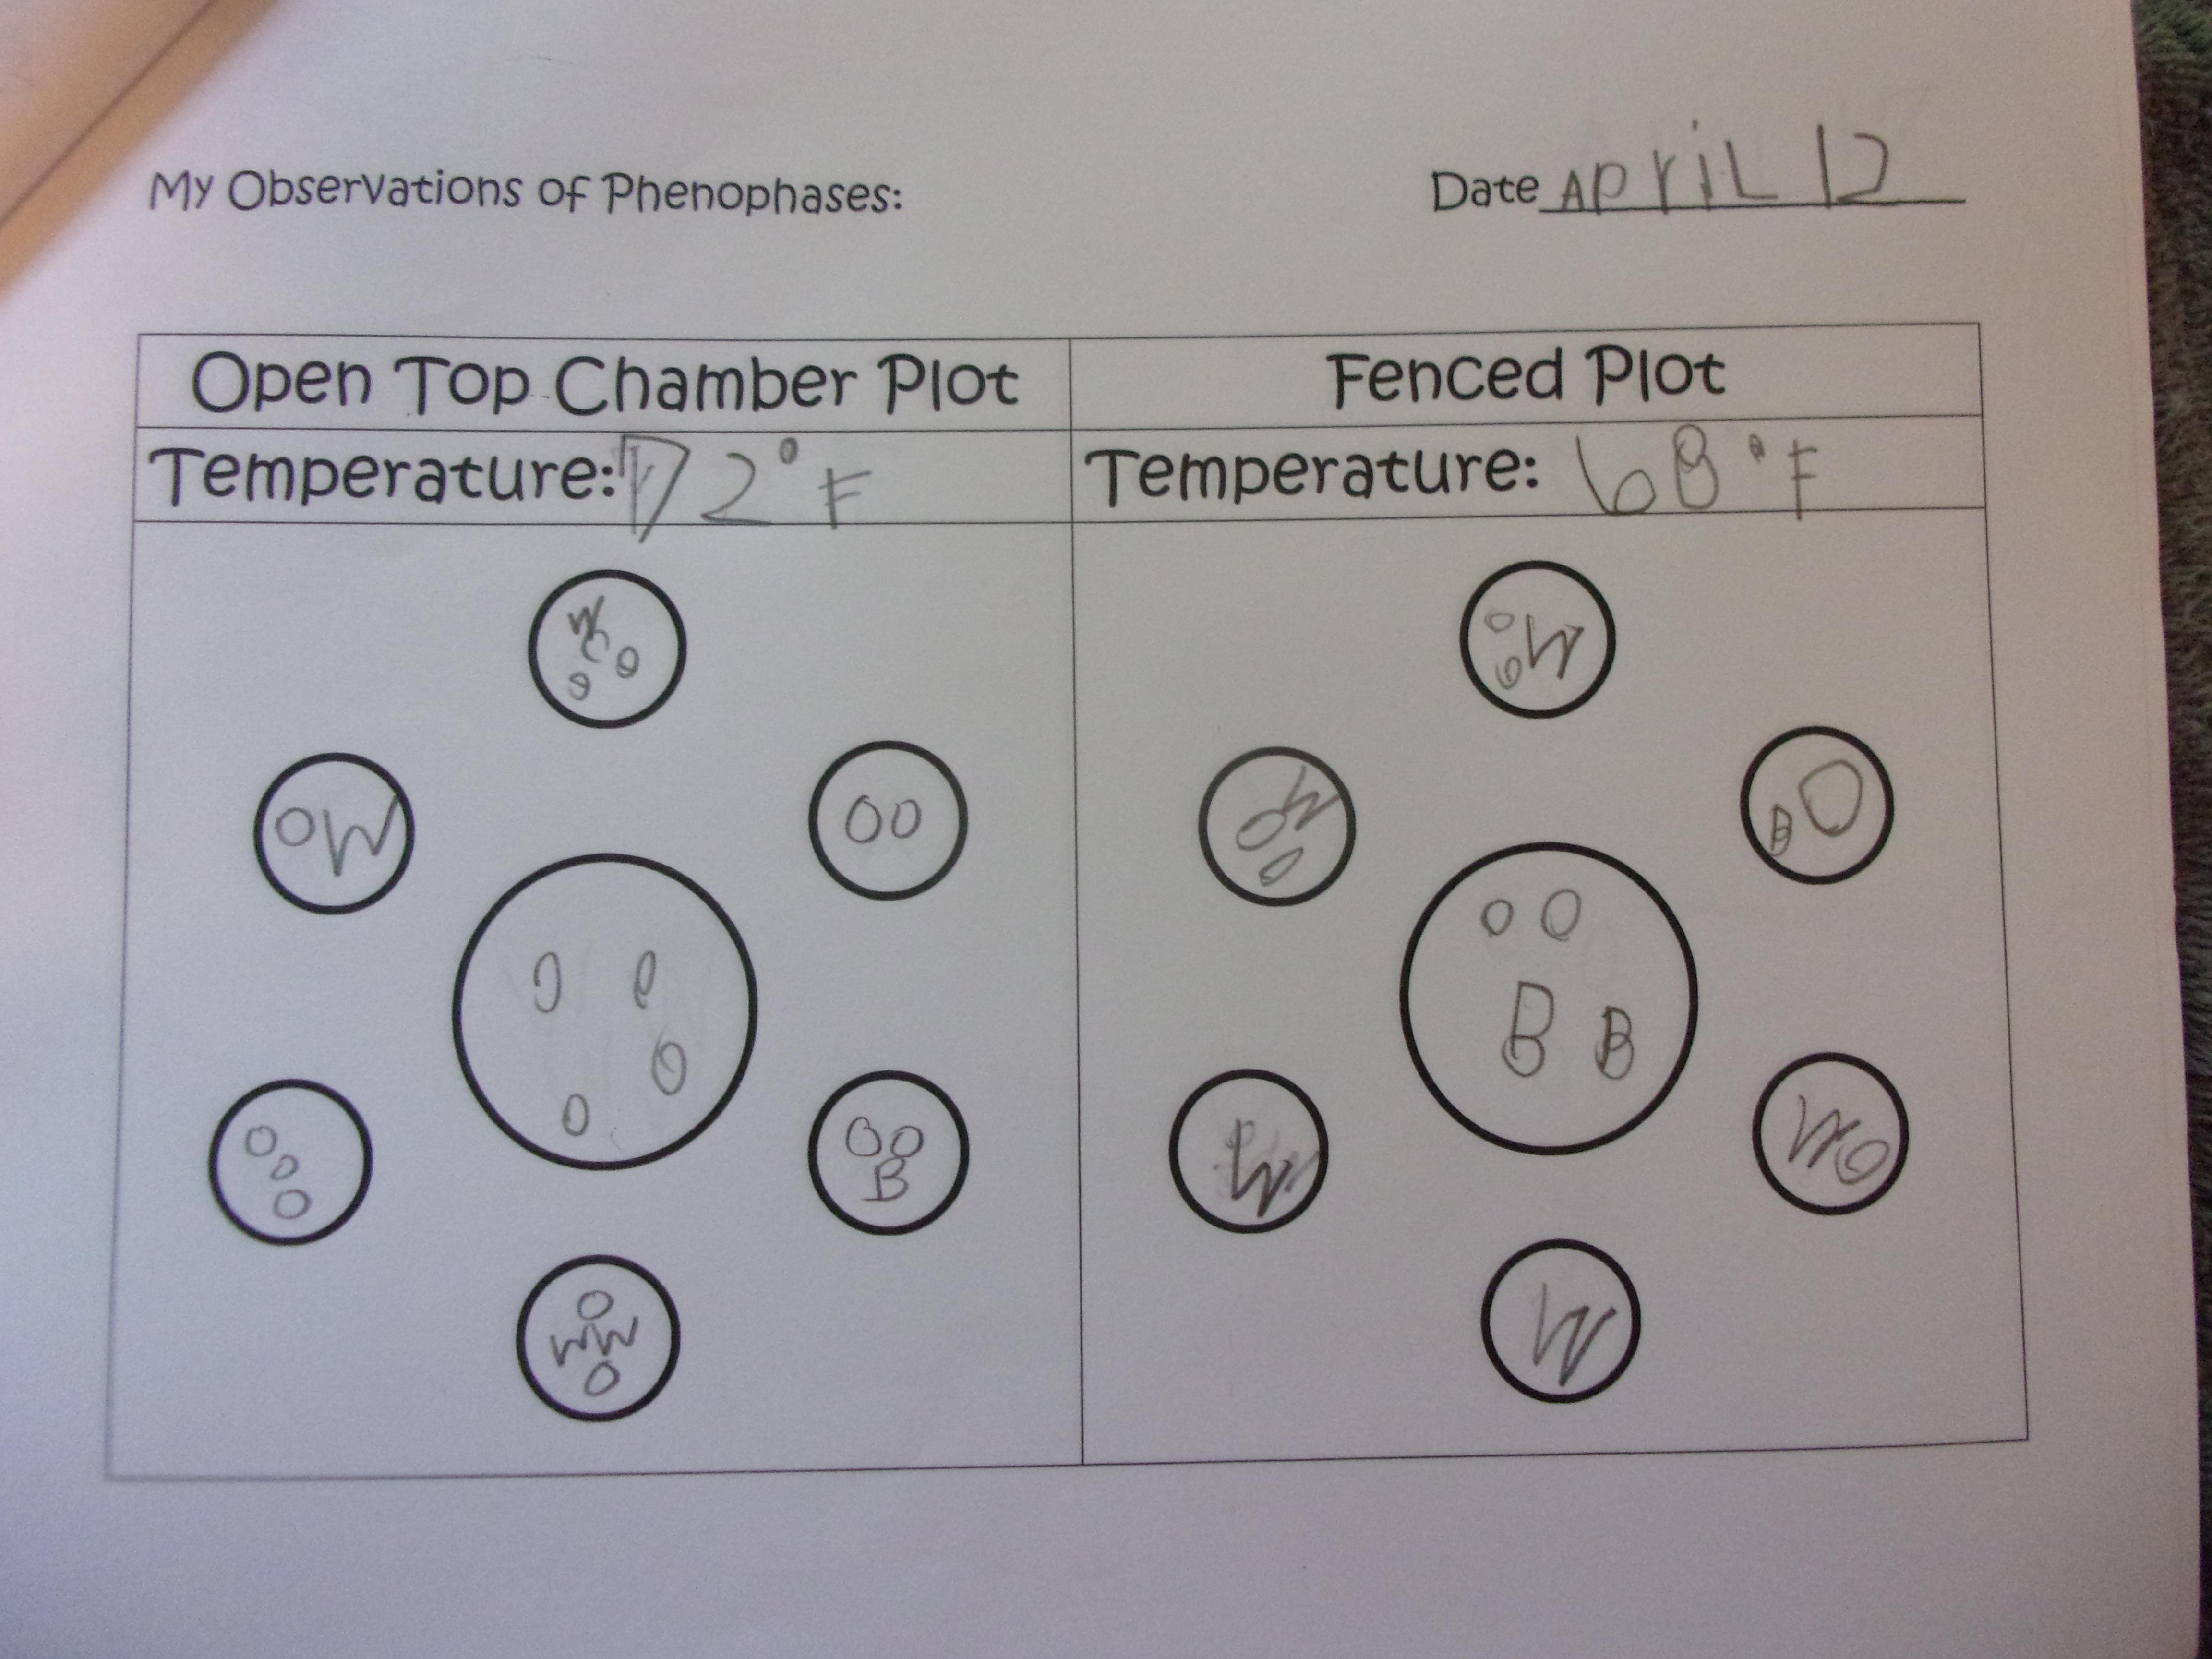
Just one week later, on April 12, both types of flowers were already blooming! However, the plants in the OTC plot pictured first have more blooms on them than the plants in the fenced plot pictured second. The students noticed this right off, especially because it’s so obvious with the tulips in the center of the plots. Also, here you can see that I have now placed the permanent thermometers in each plot for quicker temperature readings with the students.
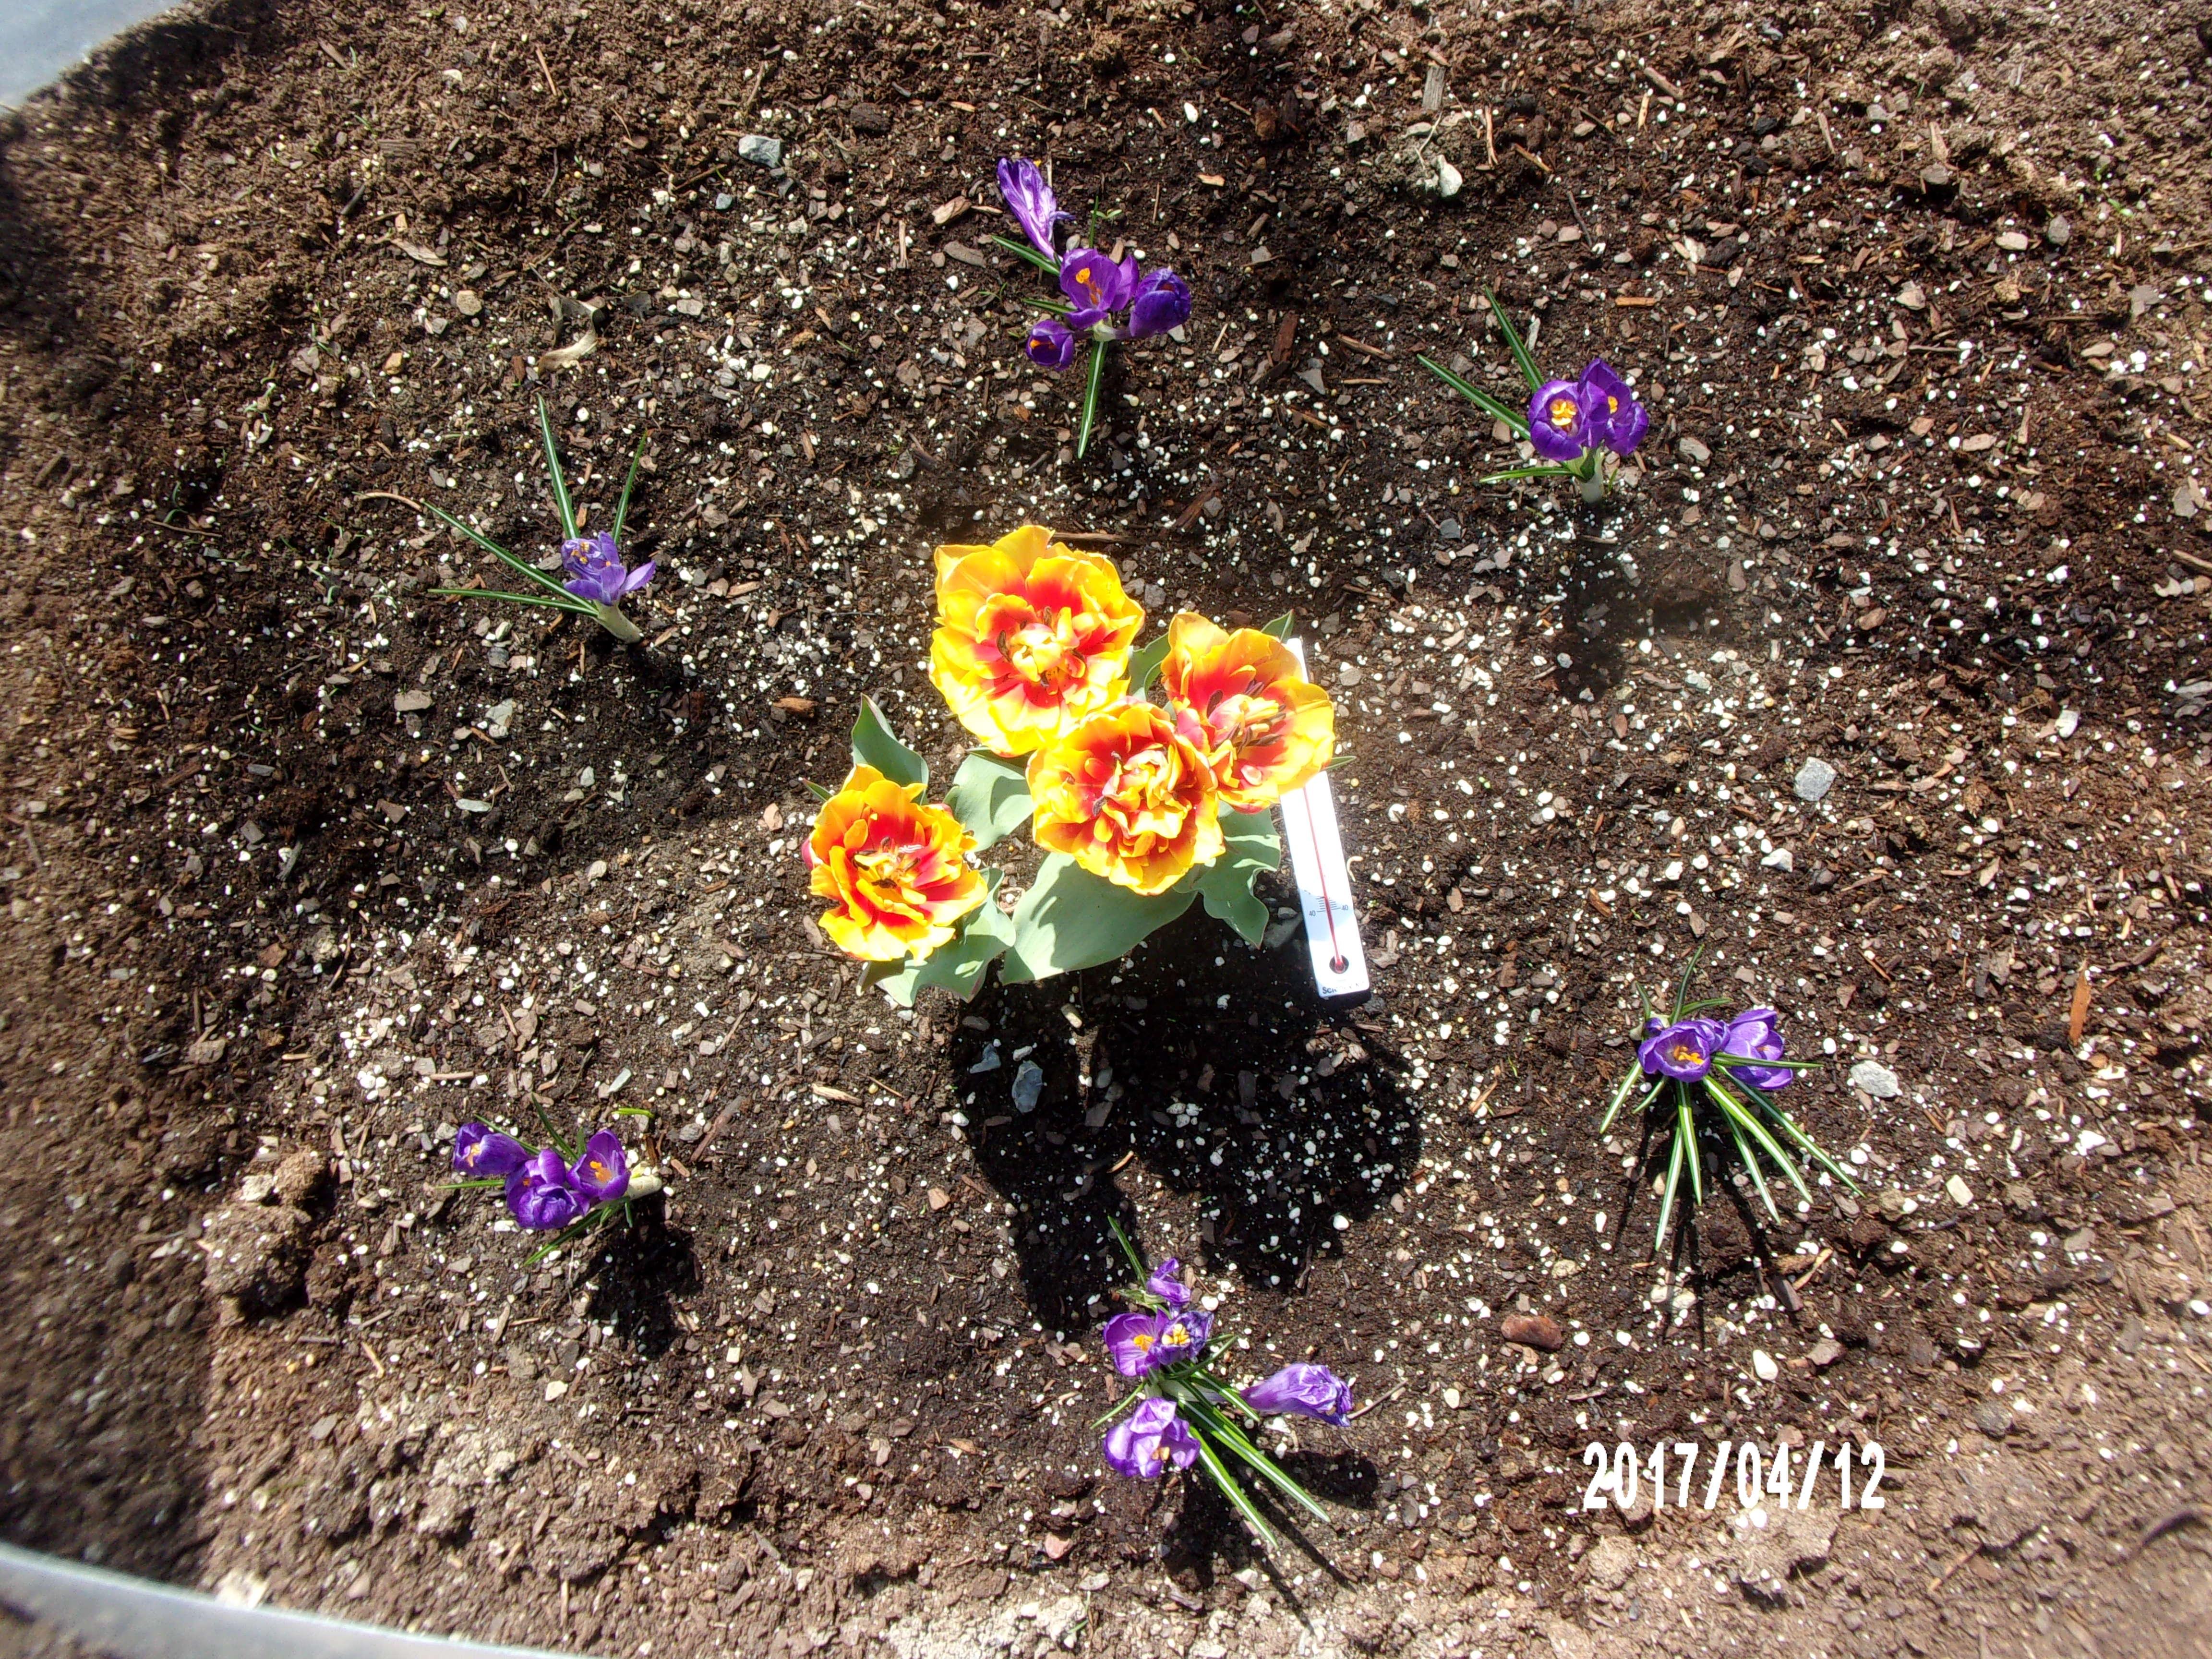
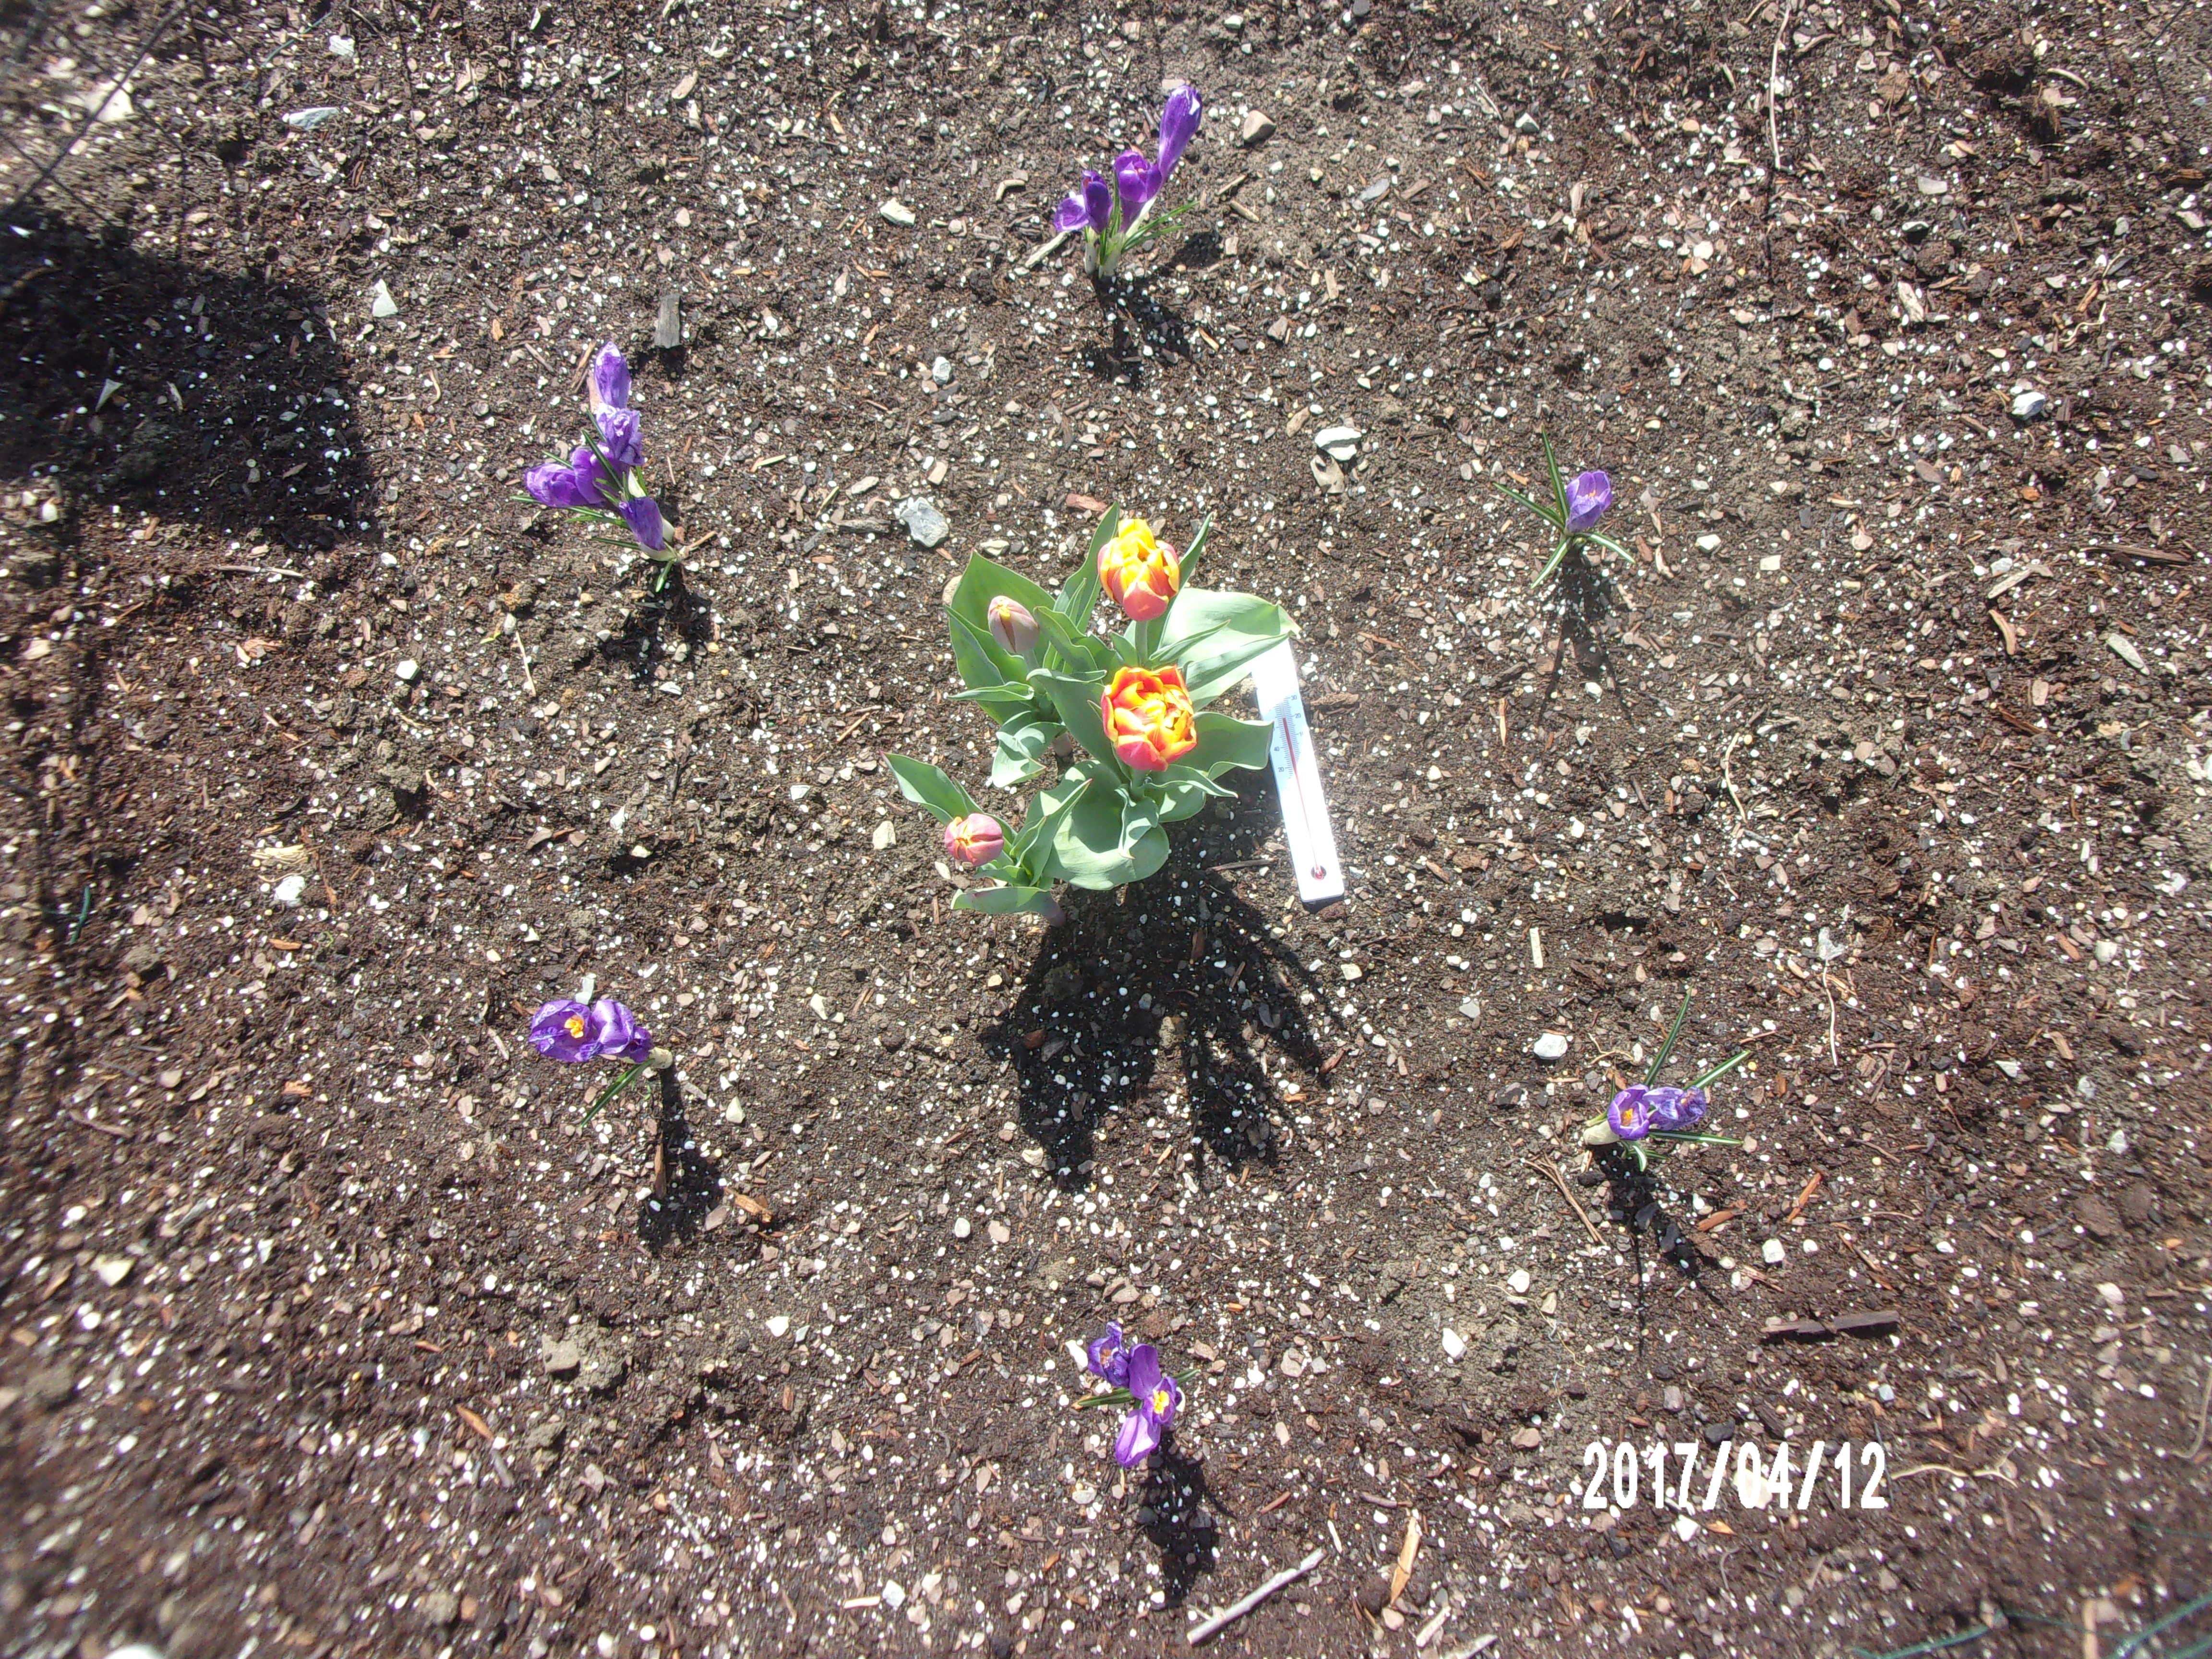
Interestingly enough, students were already noticing the crocus blooms beginning to wilt in some cases. The student shows that both plots have plants in budding, blooming, and wilting stages. As you can see the temperature in the OTC is elevated compared to the fenced plot.
By April 17, all blooms on the crocus plants were dropped, but the tulips were still blooming. The tulip plants in the OTC plot were starting to show signs of wilting already, while the tulip plants in the fenced plot still seemed to be in full bloom.
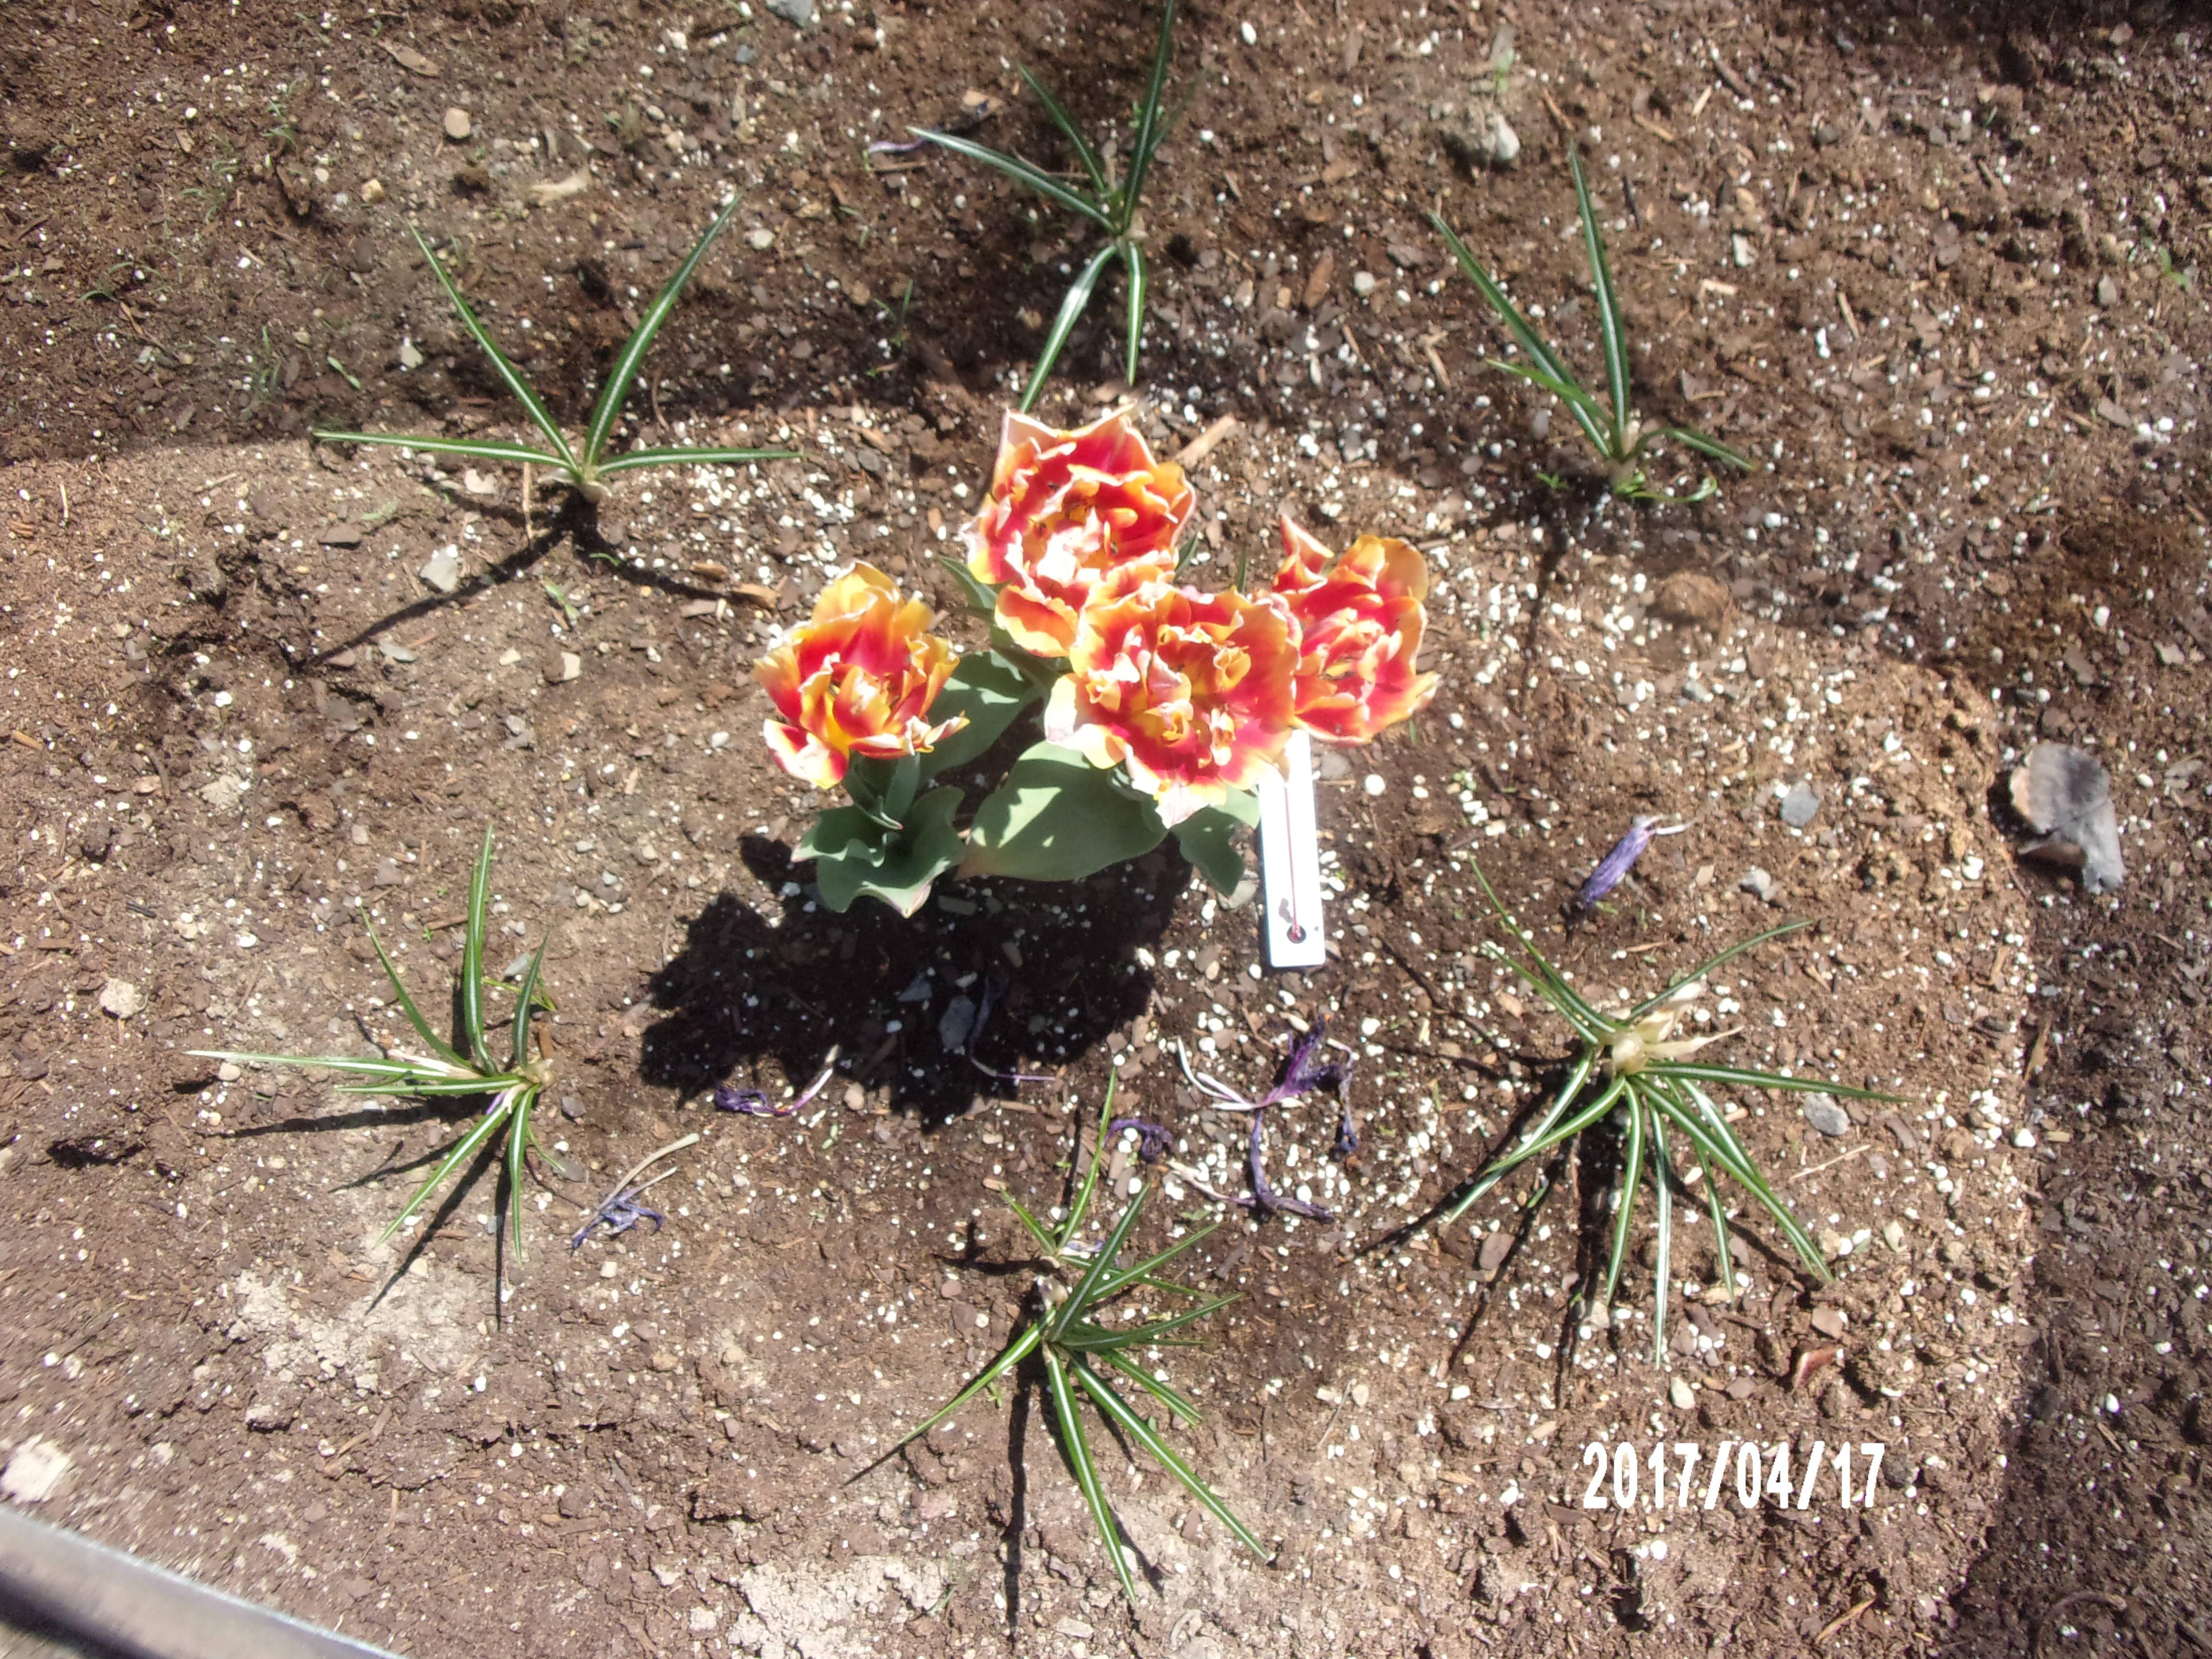
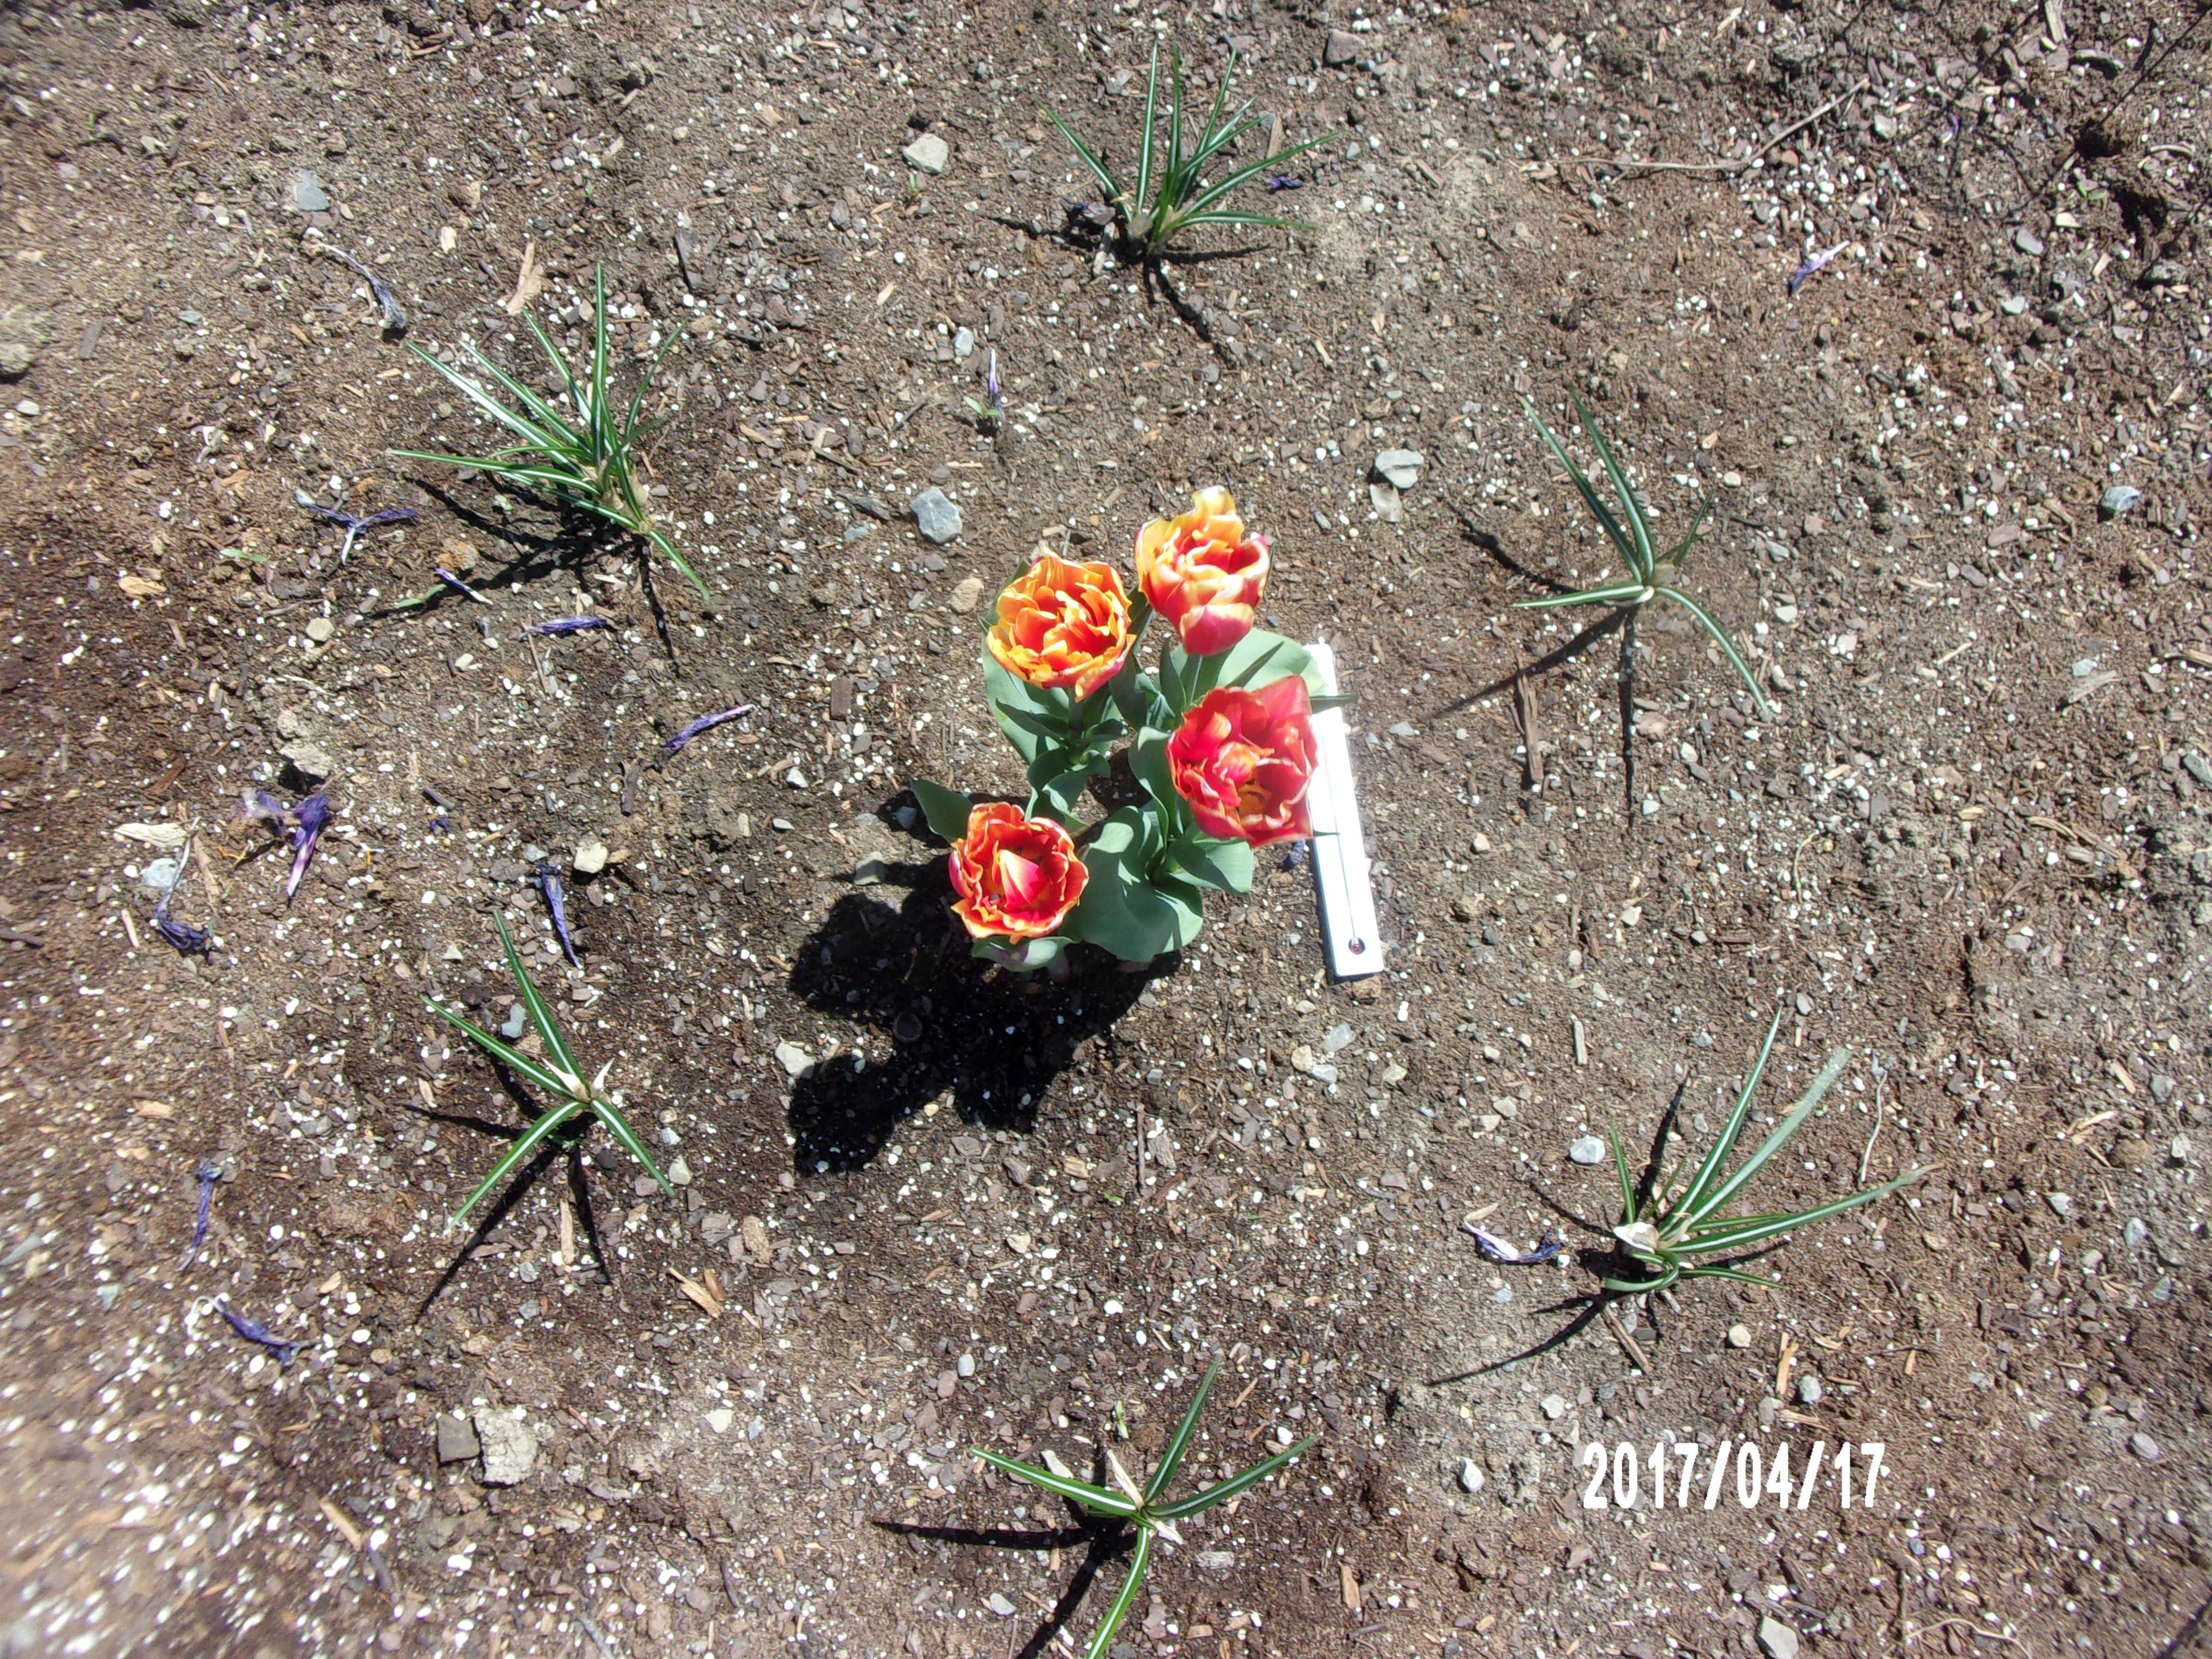
Student data for April 17 reflects the dropped blooms on the crocus plants. Additionally, the student identifies the tulips in the OTC as wilted. You can see that the temperature in the OTC is 12 degrees hotter than the fenced plot! The students had some inferences about the differences in phenophases noting that they thought since the OTC was hotter it meant that the plants were drying up quicker with the water evaporating quicker.
On April 27, our last day of phenophase observations, both types of plants have dropped their petals completely off in both plots. It did happen a little quicker in the OTC plot, but only by a few days.
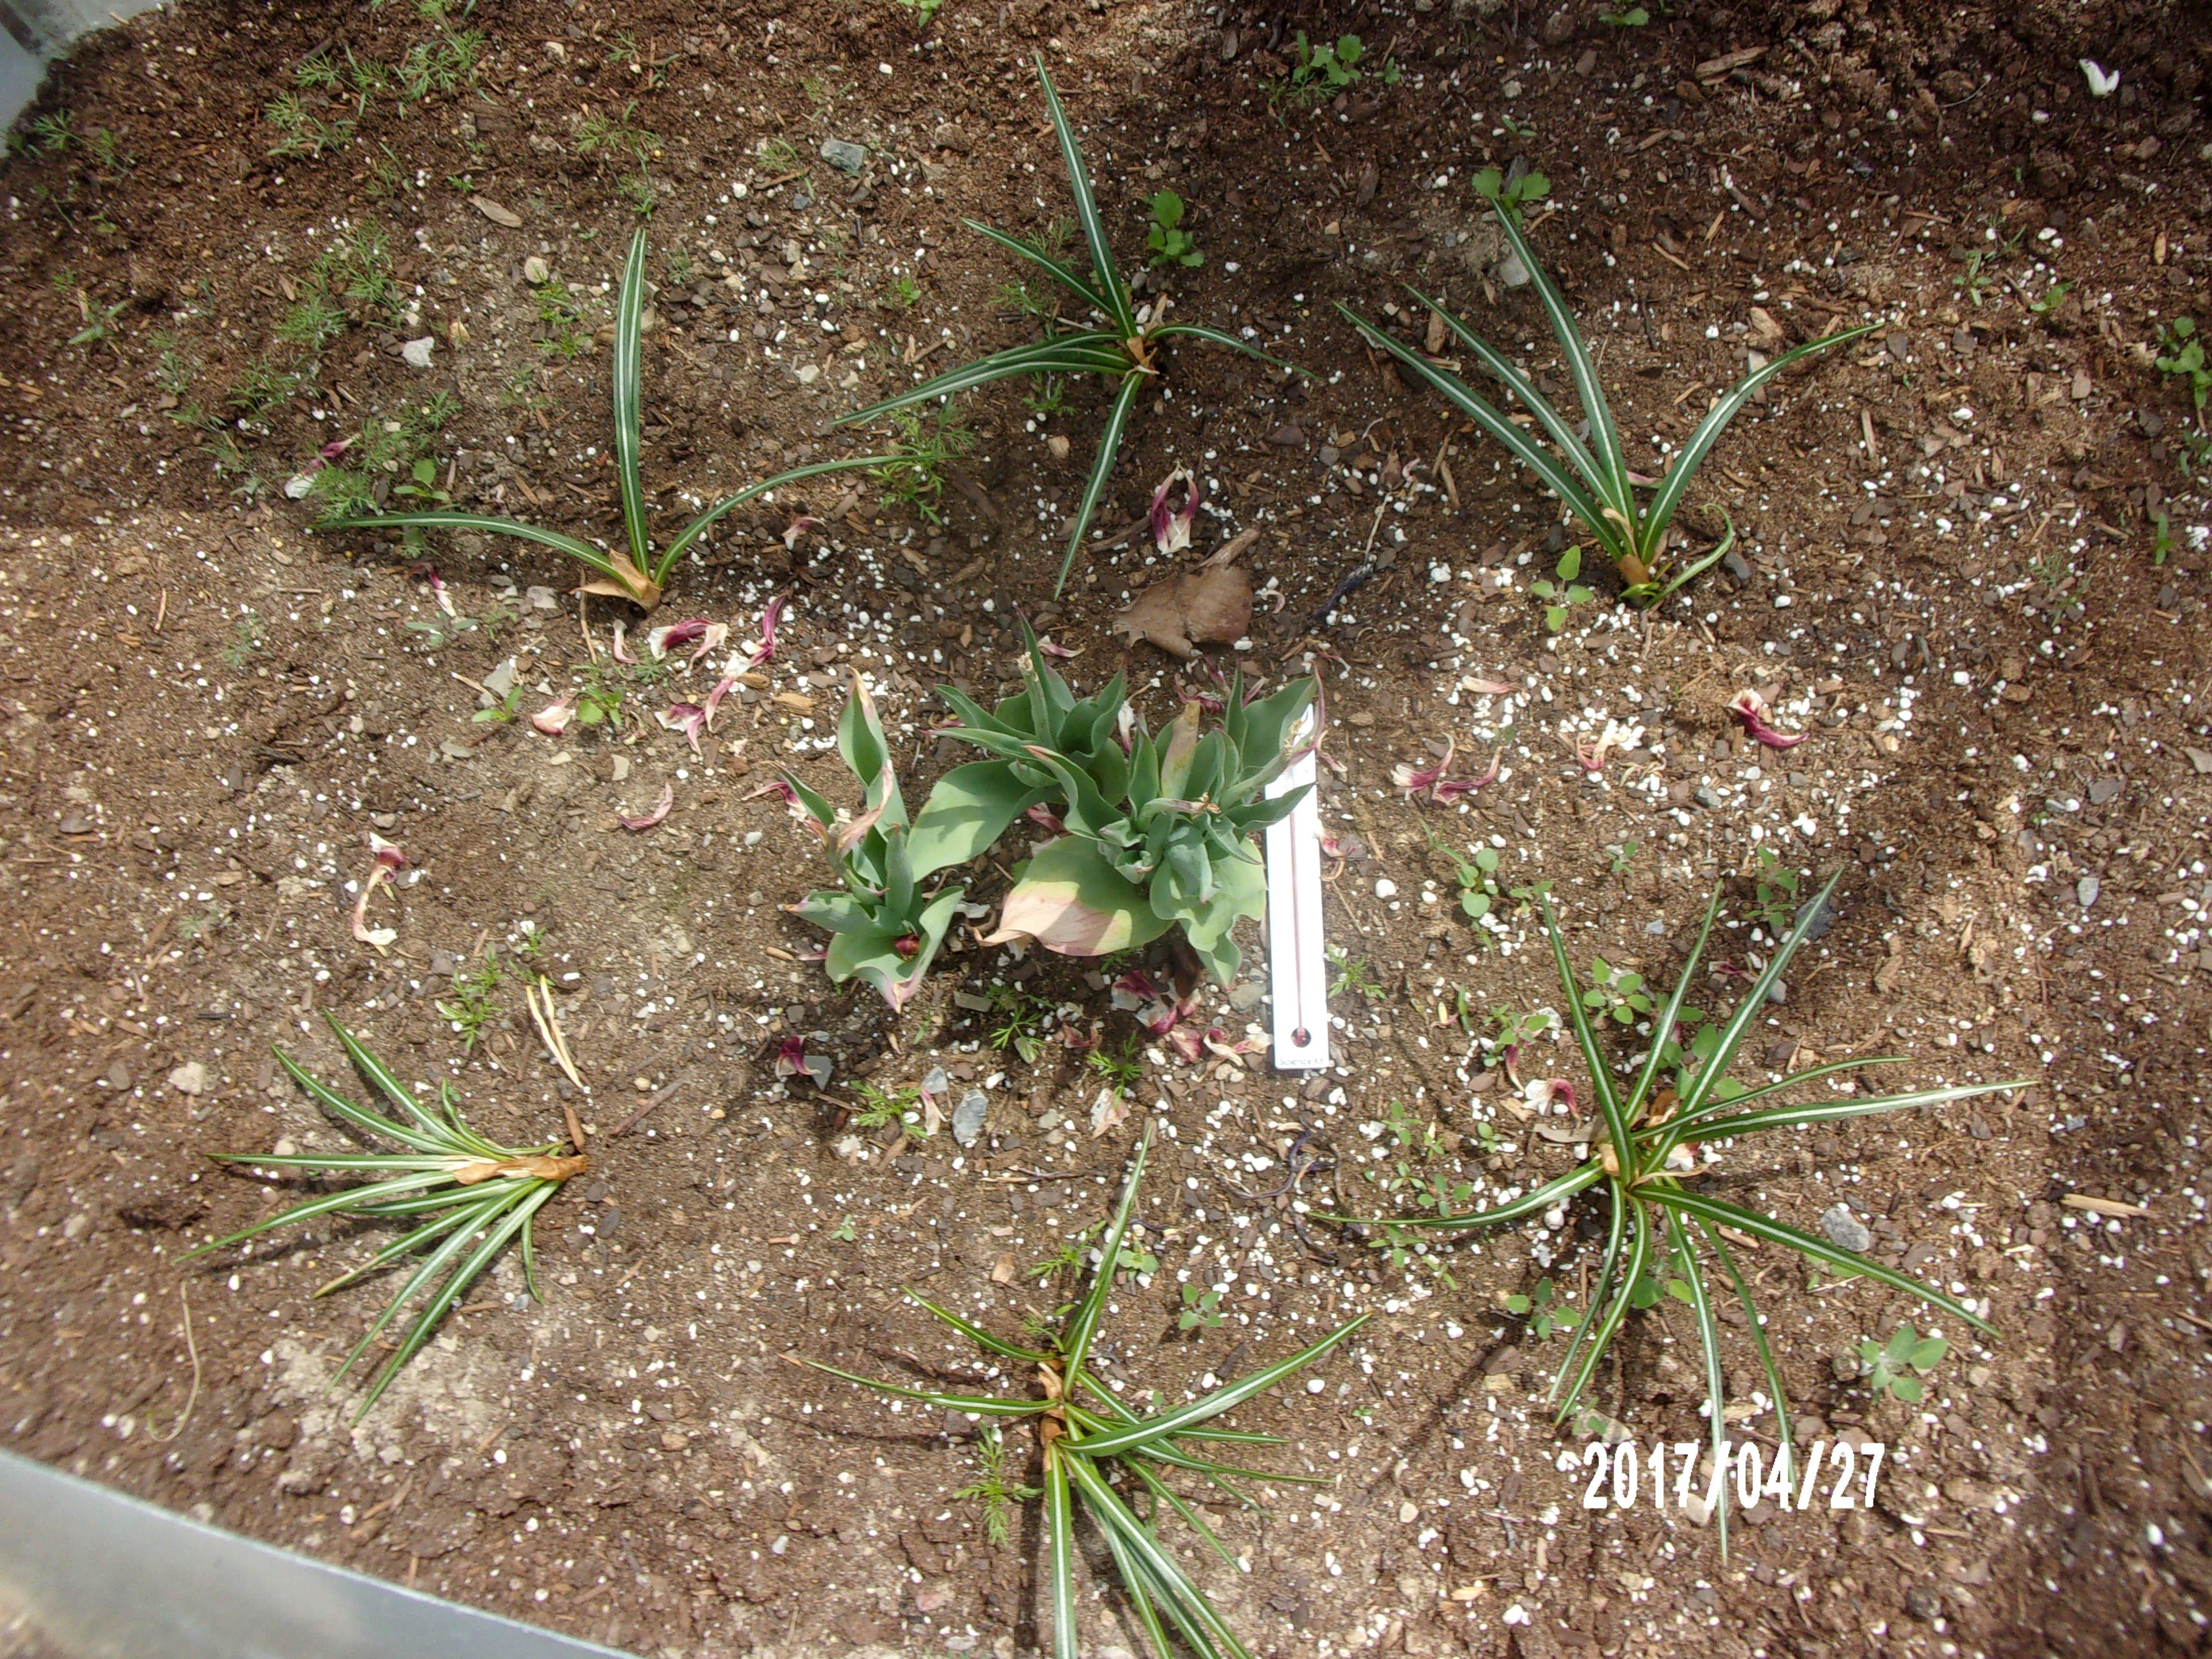
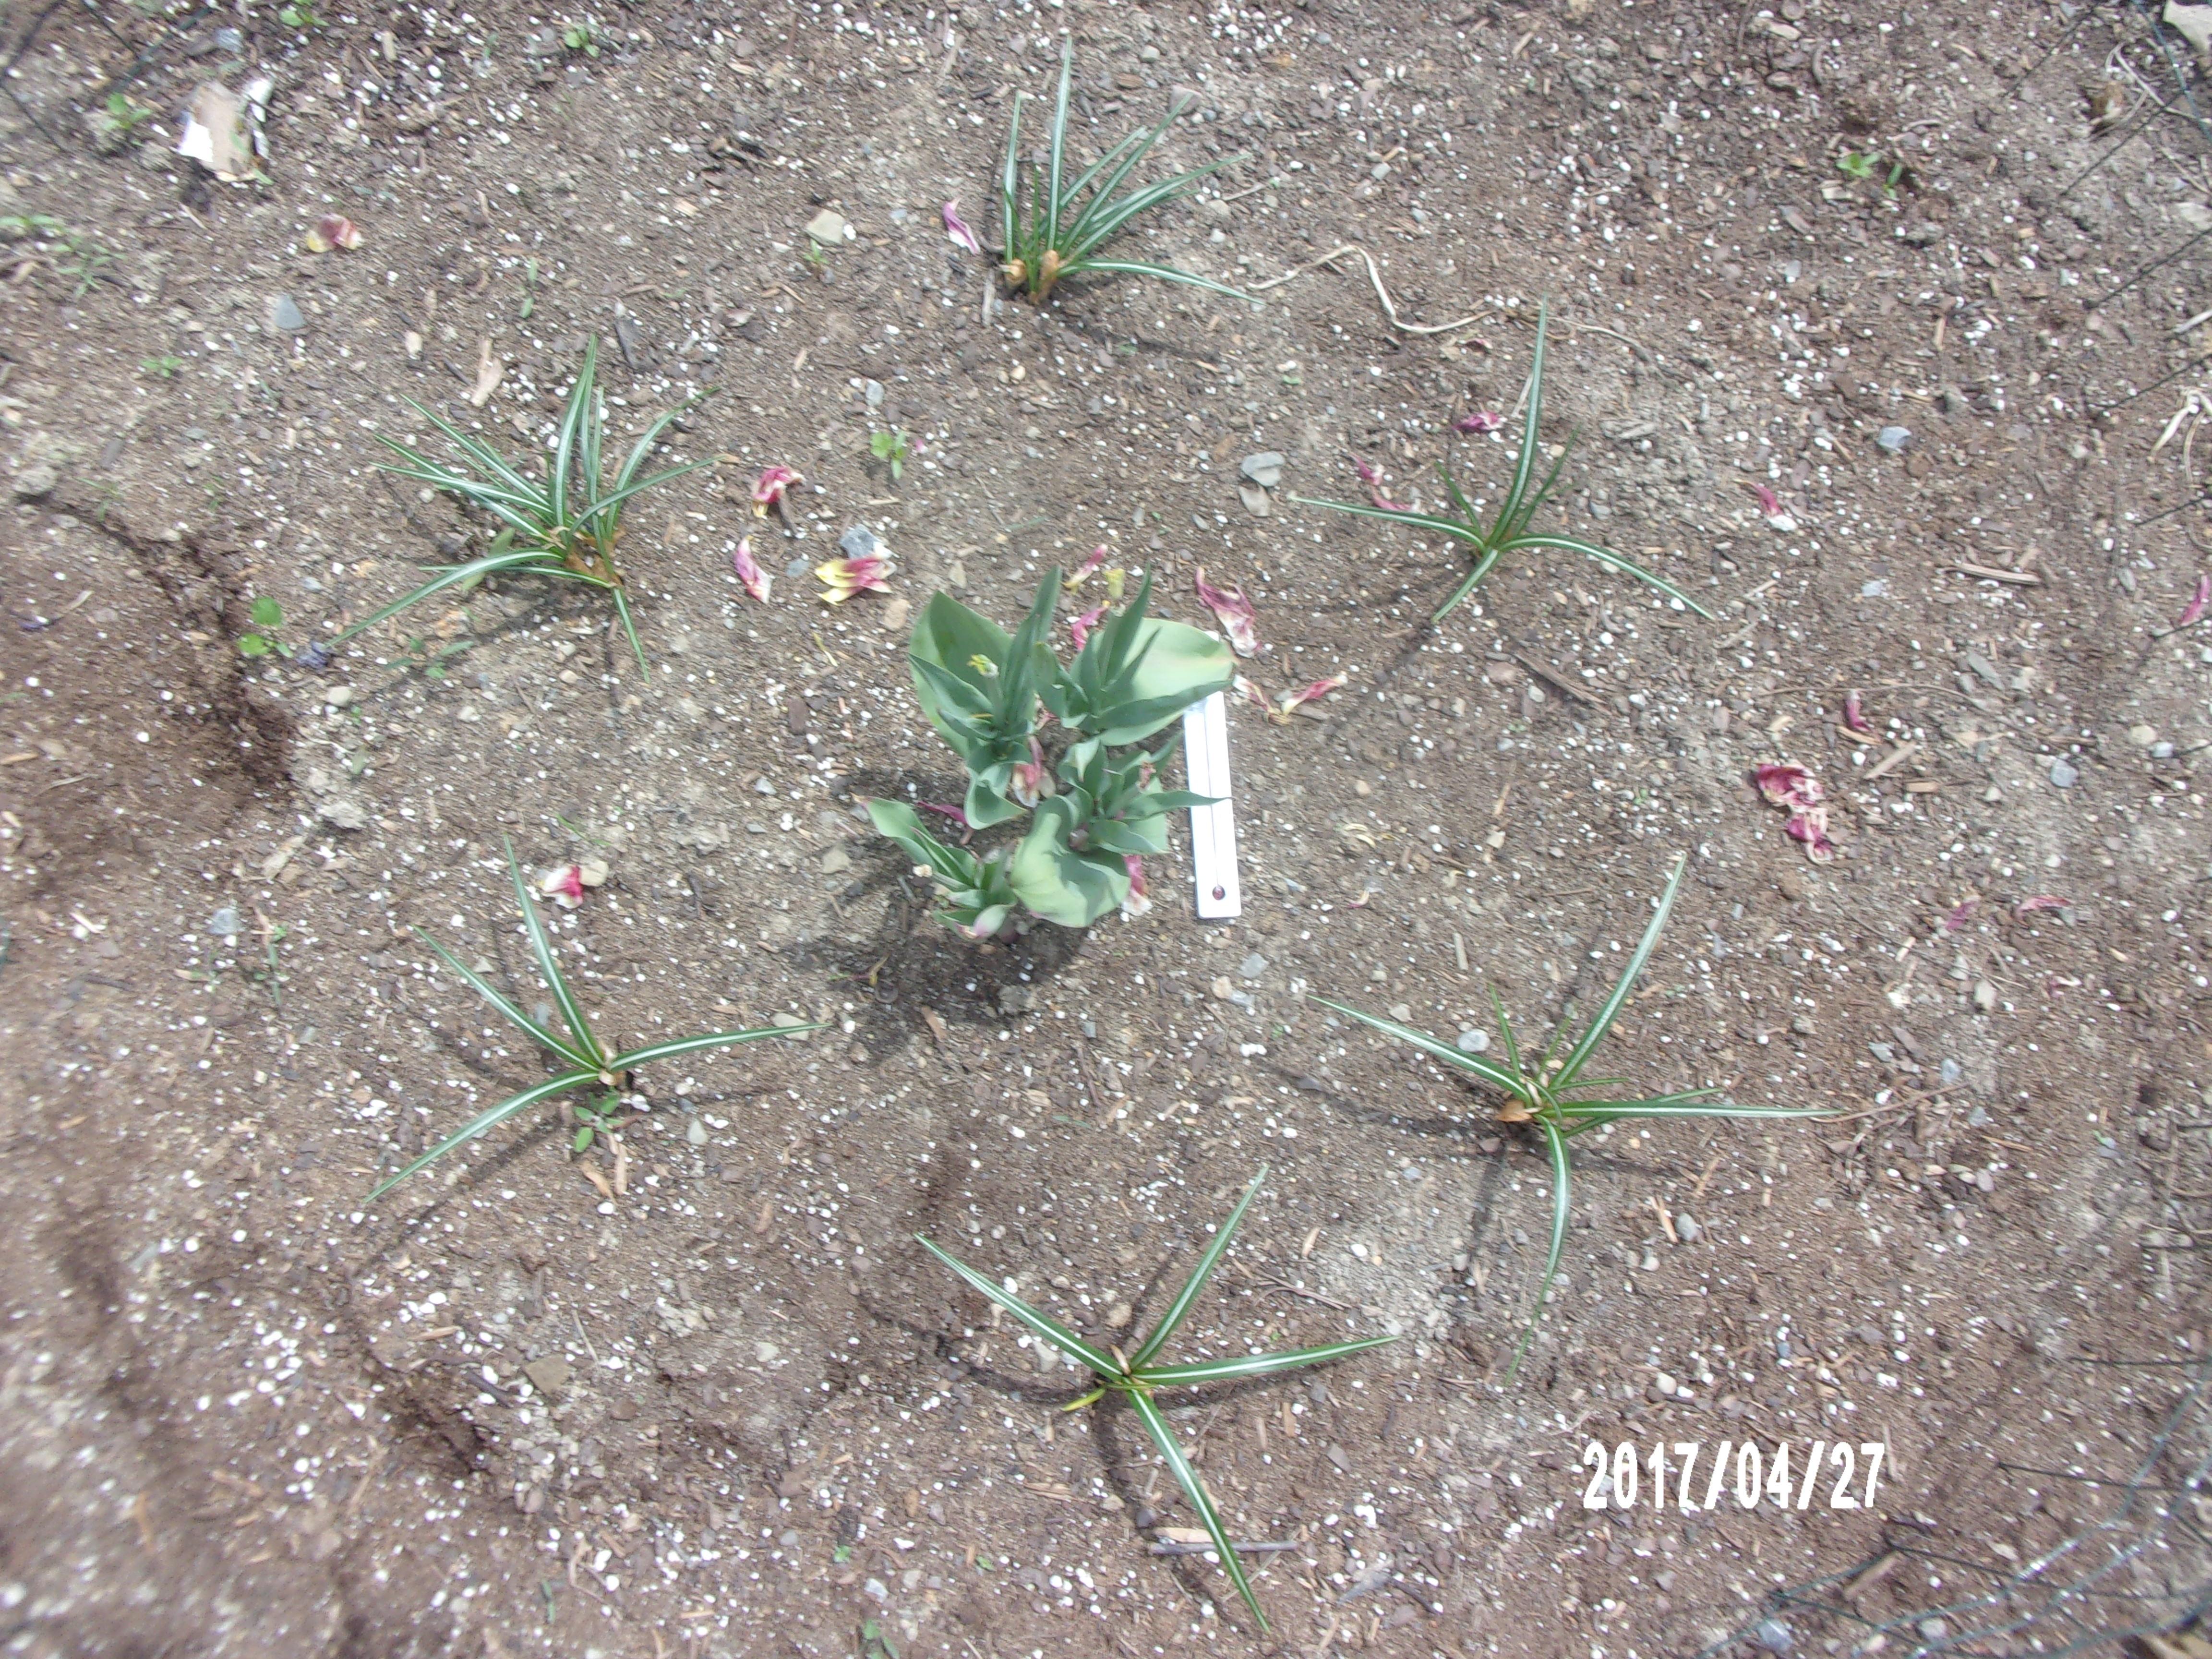
Student observations in a journal for April 27 indicates all the dropped petals on both plants in both plots. It is interesting to note that students were questioning if the plants were now dead. As we continued the final discussion of the plant phenology project, we discussed how the plants were in another stage in their growth, perhaps happening where we couldn’t see it…underground. During the final week of school, we plan to dig up one of the plants from each plot to examine the possible underground changes.
Analyzing the data from our plant phenology journals was another lesson that I conducted with the students. I look forward to sharing this post with the group in the forum soon!
-
AuthorPosts
- You must be logged in to reply to this topic.
Recent Comments